Use metrics to evaluate
Once you have deployed Viva Connections, there are certain metrics you can use to determine the effectiveness of Viva Connections. The effectiveness of Viva Connections is related to the scenarios that were prioritized during the planning phase. For example, if your organization wants to reduce requests to the HR team and instead wants to encourage self-service using Viva Connections – one metric used to evaluate the effectiveness will be the volume of requests to HR. If Viva Connections is effective in this scenario, an organization can expect to see a reduction in requests and an increase in usage of self-service cards.
Through site level and page level usage reports in SharePoint, you can get a sense for how much your employees are truly engaging with certain components of Viva Connections. You can also see exactly the average time that users spend on pages, which can help you determine which features are the most useful.
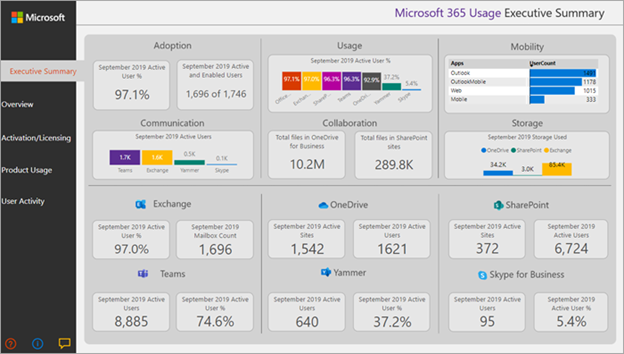
For a more high-level view of how your employees are using Viva Connections, Microsoft 365 usage analytics provides access to a dashboard. This dashboard includes pre-built reports about the adoption of different Microsoft 365 apps, usage, communication, and collaboration.
To measure how successful Viva Connections is more directly, consider creating feedback channels. Employees can give insight into exactly what works and what doesn’t through these channels. Consider using a Link card on the Viva Connections Dashboard that links users to aMicrosoft Form. The Microsoft form will collect employee feedback like rating their satisfaction with the platform, how useful it is in their daily life, and what features they use the most. Yammer or Teams channels can also be used to collect employee feedback.
![]()
Learn how Lamna Healthcare uses metrics to track progress
After the launch, you work with the Viva Connections planning team at Lamna Healthcare monitors and evaluates the effectiveness of Viva Connections and makes continued adjustments based on the insights they gain from different metrics. When reviewing the site level and page level usage reports in SharePoint, the planning team discovered the page “Find a Provider” is among the most visited pages. You decide to add this page as a quick link in Resources.
In addition to monitoring usage analytics and viewing behavior, Lamna HealthCare’s HR department wants to know how Viva Connections helps answer common questions or complete tasks. Specifically, they want to know how self-service cards, such as the Benefits card, and the Payroll card are helping employees. Since the launch, HR observes a drop in the number of emails and messages in Teams that they receive. Site and page level usage report helps the planning team confirm this trend - the HR portals are among the most popular sites and site traffic shows that more people are accessing HR sites than before the launch of Viva Connections.
Another metric Lamna Healthcare is prioritizing, is the overall satisfaction of the experience amongst different roles and regions. Overall, employees are happy with the resources and tools provided by Viva Connections. One employee said, “I love the new landing page in Teams! Now I can get my work done in one place” when asked about Viva Connections in a company poll. Another employee said “Finally, I can get everything done on my mobile device. I don’t have time to sit down at a computer for basic tasks like clocking into my shift.” Meanwhile, other employees mention that they wish they had more functions in Viva Connections. For example, they wish to have a feature that helps them make time in their schedule for training and learning opportunities. The planning team captures this request and will learn if this need applies to other roles too before considering the priority of the request.