Troubleshoot missing application telemetry in Azure Monitor Application Insights
This article helps you to identify the step in the processing pipeline that causes telemetry to be missing by testing connectivity and telemetry ingestion using PowerShell or curl.
Steps that can cause telemetry to be missing
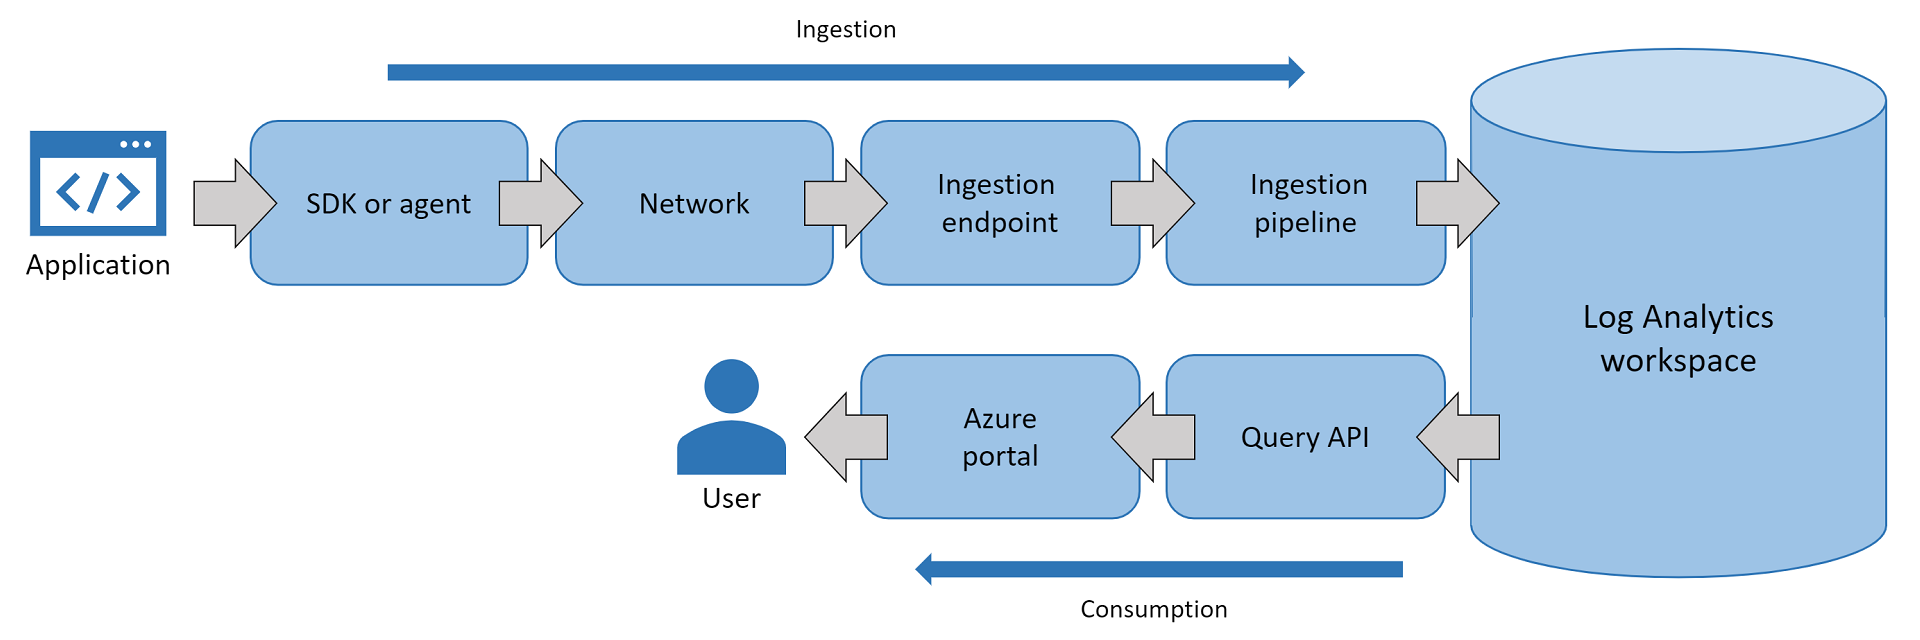
The following graphic shows steps where telemetry can be missing during ingestion and consumption:

If application telemetry doesn't show in the Azure portal, failures across steps in the processing pipeline could be the cause:
- The Application Insights SDK or agent is misconfigured and doesn't send application telemetry to the ingestion endpoint.
- The SDK or agent is configured correctly, but the network blocks calls to the ingestion endpoint.
- The ingestion endpoint drops or throttles inbound telemetry.
- The ingestion pipeline drops or severely slows down telemetry as part of its processing due to service health.
- (Uncommon) Log Analytics faces service health problems when saving telemetry records.
- (Uncommon) The query API at
api.applicationinsights.iofails when querying records from Log Analytics. - The Azure portal fails to pull or render the records you're trying to view.
Identify step by sending sample telemetry record
Configuration problems or transient issues may occur anywhere across the Applications Insights service. To identify the step within the processing pipeline that causes symptoms of no data or missing data, send a sample telemetry record by using PowerShell or curl. For the PowerShell script or curl command, go to the following sections:
- PowerShell script to send availability test result
- Curl command to send availability test result
- PowerShell script to send request telemetry record
If the web app runs on an on-premises server or Azure VM, connect to the server or VM and send a single telemetry record to the Applications Insights service instance by using PowerShell. If the web app that has issues sending telemetry runs on Kudu, run the following script from Kudu's PowerShell debug console in Azure Web Apps.
$ProgressPreference = "SilentlyContinue"
Invoke-WebRequest -Uri $url -Method POST -Body $availabilityData -UseBasicParsing
Note
- Before running the
Invoke-WebRequestcmdlet, issue the$ProgressPreference = "SilentlyContinue"cmdlet. - You can't use
-Verboseor-Debug. Instead, use-UseBasicParsing.
After you send a sample telemetry record by using PowerShell, navigate to the Application Insights Logs tab in the Azure portal and check if it arrives. If the sample telemetry record is shown, then a large portion of the processing pipeline is eliminated.
A sample telemetry record that's correctly saved and displayed means:
- The local server or VM has DNS that resolves to the correct IP address.
- The network delivered the sample to the ingestion endpoint without blocking or dropping.
- The ingestion endpoint accepted the sample payload and processed it through the ingestion pipeline.
- Log Analytics correctly saved the sample record.
- The Azure portal Logs tab is able to query the API (
api.applicationinsights.io) and render the sample record in the Azure portal.
If the generated sample record arrives at your Application Insights instance and you can query for the sample record by using the Logs resource menu, troubleshoot the Application Insights SDK or agent. You can then proceed with collecting SDK logs, self-diagnostic logs, or profiler traces, whichever is appropriate for the SDK or agent version.
The following sections provide information about sending a sample telemetry record using PowerShell or curl.
PowerShell script to send availability test result
Availability test results are the ideal telemetry type to test with. The reason is that the ingestion pipeline never samples out availability test results. If you send a request telemetry record, it could get sampled out when you have enabled ingestion sampling. Start with a sample availability test result and then try other telemetry types as needed.
Here's a sample PowerShell script that sends an availability test result:
# Info: Provide either the connection string or ikey for your Application Insights resource
$ConnectionString = ""
$InstrumentationKey = ""
function ParseConnectionString {
param ([string]$ConnectionString)
  $Map = @{}
  foreach ($Part in $ConnectionString.Split(";")) {
     $KeyValue = $Part.Split("=")
     $Map.Add($KeyValue[0], $KeyValue[1])
  }
  return $Map
}
# If ikey is the only parameter supplied, we'll send telemetry to the global ingestion endpoint instead of regional endpoint found in connection strings
If (($InstrumentationKey) -and ("" -eq $ConnectionString)) {
$ConnectionString = "InstrumentationKey=$InstrumentationKey;IngestionEndpoint=https://dc.services.visualstudio.com/"
}
$map = ParseConnectionString($ConnectionString)
$url = $map["IngestionEndpoint"] + "v2/track"
$ikey = $map["InstrumentationKey"]
$lmUrl = $map["LiveEndpoint"]
$time = (Get-Date).ToUniversalTime().ToString("o")
$availabilityData = @"
{
  "data": {
        "baseData": {
            "ver": 2,
            "id": "SampleRunId",
            "name": "Microsoft Support Sample Webtest Result",
            "duration": "00.00:00:10",
            "success": true,
            "runLocation": "Region Name",
            "message": "Sample Webtest Result",
            "properties": {
                "Sample Property": "Sample Value"
                }
        },
        "baseType": "AvailabilityData"
  },
  "ver": 1,
  "name": "Microsoft.ApplicationInsights.Metric",
  "time": "$time",
  "sampleRate": 100,
  "iKey": "$ikey",
  "flags": 0
}
"@
# Uncomment one or more of the following lines to test client TLS/SSL protocols other than the machine default option
# [System.Net.ServicePointManager]::SecurityProtocol = [System.Net.SecurityProtocolType]::SSL3
# [System.Net.ServicePointManager]::SecurityProtocol = [System.Net.SecurityProtocolType]::TLS
# [System.Net.ServicePointManager]::SecurityProtocol = [System.Net.SecurityProtocolType]::TLS11
# [System.Net.ServicePointManager]::SecurityProtocol = [System.Net.SecurityProtocolType]::TLS12
# [System.Net.ServicePointManager]::SecurityProtocol = [System.Net.SecurityProtocolType]::TLS13
$ProgressPreference = "SilentlyContinue"
Invoke-WebRequest -Uri $url -Method POST -Body $availabilityData -UseBasicParsing
This script builds a raw REST request to deliver a single availability test result to the Application Insights component. When you use this script, supply the $ConnectionString or $InstrumentationKey parameter.
- If only the connection string parameter is supplied, telemetry will be sent to the regional endpoint in the connection string.
- If only the instrumentation key (ikey) parameter is supplied, telemetry will be sent to the global ingestion endpoint.
- If both connection string and ikey parameters are supplied, the script will send telemetry to the regional endpoint in the connection string.
Note
- Test the connection made by your application. If you enable Application Insights in the Azure portal, you likely rely on connection strings with regional endpoints,
https://<region>.in.applicationinsights.azure.com. If your SDK configuration only supplies the ikey, you rely on the global endpoint,https://dc.applicationinsights.azure.com. Make sure to populate the script parameter that matches your web application SDK configuration, either supplying the connection string or the ikey. - On March 31, 2025, support for instrumentation key ingestion will end. Instrumentation key ingestion will continue to work, but we'll no longer provide updates or support for the feature. Transition to connection strings to take advantage of new capabilities.
It's easiest to run this script from the PowerShell ISE environment on an IaaS or Azure virtual machine scale set instance. You can also copy and paste the script into the App Service Kudu interface PowerShell debug console and then run it.
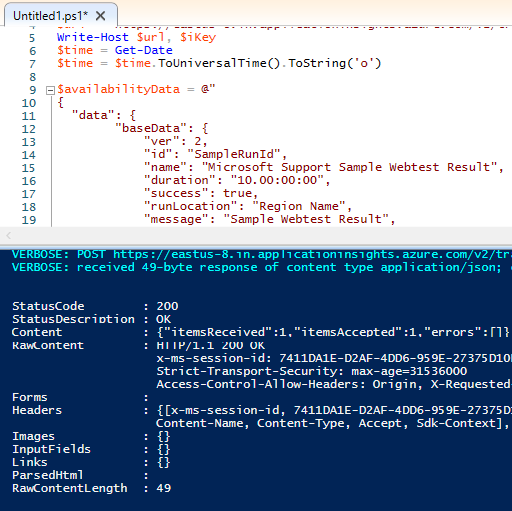
When the script is executed, look for an HTTP 200 response and review the response details. As part of the response JSON payload, the following details are expected:
- The
itemsReceivedcount matches theitemsAccepted. - The ingestion endpoint informs the client: you sent one telemetry record, and we accepted one telemetry record.
Refer to the following screenshot as an example:

Curl command to send availability test result
If you're running Linux VMs, use curl instead of PowerShell to send a similar REST request. You need to adjust the ingestion endpoint hostname, the iKey value, and the time values. The Application Insights ingestion endpoint doesn't accept any records older than 48 hours.
Here are sample curl commands that send a single availability test result:
Curl command for Linux/MacOS:
curl -H "Content-Type: application/json" -X POST -d '{"data":{"baseData":{"ver":2,"id":"SampleRunId","name":"MicrosoftSupportSampleWebtestResultUsingCurl","duration":"00.00:00:10","success":true,"runLocation":"RegionName","message":"SampleWebtestResult","properties":{"SampleProperty":"SampleValue"}},"baseType":"AvailabilityData"},"ver":1,"name":"Microsoft.ApplicationInsights.Metric","time":"2022-09-01T12:00:00.0000000Z","sampleRate":100,"iKey":"########-####-####-####-############","flags":0}' https://dc.applicationinsights.azure.com/v2.1/trackCurl command for Windows:
curl -H "Content-Type: application/json" -X POST -d {\"data\":{\"baseData\":{\"ver\":2,\"id\":\"SampleRunId\",\"name\":\"MicrosoftSupportSampleWebtestResultUsingCurl\",\"duration\":\"00.00:00:10\",\"success\":true,\"runLocation\":\"RegionName\",\"message\":\"SampleWebtestResult\",\"properties\":{\"SampleProperty\":\"SampleValue\"}},\"baseType\":\"AvailabilityData\"},\"ver\":1,\"name\":\"Microsoft.ApplicationInsights.Metric\",\"time\":\"2021-10-05T22:00:00.0000000Z\",\"sampleRate\":100,\"iKey\":\"########-####-####-####-############\",\"flags\":0} https://dc.applicationinsights.azure.com/v2/track
PowerShell script to send request telemetry record
To troubleshoot missing request telemetry, use the following PowerShell script to test sending a single request telemetry record. This telemetry type is susceptible to the server-side ingestion sampling configuration. Verify that ingestion sampling is turned off to confirm if the test record is saved correctly.
# Info: Provide either the connection string or ikey for your Application Insights resource
$ConnectionString = ""
$InstrumentationKey = ""
function ParseConnectionString {
param ([string]$ConnectionString)
  $Map = @{}
  foreach ($Part in $ConnectionString.Split(";")) {
     $KeyValue = $Part.Split("=")
     $Map.Add($KeyValue[0], $KeyValue[1])
  }
  return $Map
}
# If ikey is the only parameter supplied, we'll send telemetry to the global ingestion endpoint instead of regional endpoint found in connection strings
If (($InstrumentationKey) -and ("" -eq $ConnectionString)) {
$ConnectionString = "InstrumentationKey=$InstrumentationKey;IngestionEndpoint=https://dc.services.visualstudio.com/"
}
$map = ParseConnectionString($ConnectionString)
$url = $map["IngestionEndpoint"] + "v2/track"
$ikey = $map["InstrumentationKey"]
$lmUrl = $map["LiveEndpoint"]
$time = (Get-Date).ToUniversalTime().ToString("o")
$requestData = @"
{
   "data": {
      "baseType": "RequestData",
      "baseData": {
        "ver": 2,
        "id": "22093920382029384",
        "name": "GET /msftsupport/requestdata/",
        "starttime": "$time",
        "duration": "00:00:01.0000000",
        "success": true,
        "responseCode": "200",
        "url": "https://localhost:8080/requestData/sampleurl",
        "httpMethod": "GET"
       }
   },
   "ver": 1,
   "iKey": "$ikey",
   "name": "Microsoft.ApplicationInsights.Request",
   "time": "$time",
   "sampleRate": 100,
   "flags": 0
}
"@
# Uncomment one or more of the following lines to test client TLS/SSL protocols other than the machine default option
# [System.Net.ServicePointManager]::SecurityProtocol = [System.Net.SecurityProtocolType]::SSL3
# [System.Net.ServicePointManager]::SecurityProtocol = [System.Net.SecurityProtocolType]::TLS
# [System.Net.ServicePointManager]::SecurityProtocol = [System.Net.SecurityProtocolType]::TLS11
# [System.Net.ServicePointManager]::SecurityProtocol = [System.Net.SecurityProtocolType]::TLS12
# [System.Net.ServicePointManager]::SecurityProtocol = [System.Net.SecurityProtocolType]::TLS13
$ProgressPreference = "SilentlyContinue"
Invoke-WebRequest -Uri $url -Method POST -Body $requestData -UseBasicParsing
Troubleshoot SSL or TLS configuration
If the scripts above fail, troubleshoot the SSL or TLS configuration. Most ingestion endpoints require clients to use TLS 1.2 and specific cipher suites. In this case, adjust how PowerShell participates as a client in the SSL or TLS protocol. Include the following snippets if you need to diagnose a secure channel as part of the connection between the client VM and the ingestion endpoints.
Option 1: Control which SSL or TLS protocol is used by PowerShell to make a connection to the ingestion endpoint.
Uncomment any of the following lines by removing the
#character and add them before theInvoke-WebRequestcmdlet in your PowerShell script to control the protocol used in the test REST request:# Uncomment one or more of these lines to test TLS/SSL protocols other than the machine default option # [System.Net.ServicePointManager]::SecurityProtocol = [System.Net.SecurityProtocolType]::SSL3 # [System.Net.ServicePointManager]::SecurityProtocol = [System.Net.SecurityProtocolType]::TLS # [System.Net.ServicePointManager]::SecurityProtocol = [System.Net.SecurityProtocolType]::TLS11 # [System.Net.ServicePointManager]::SecurityProtocol = [System.Net.SecurityProtocolType]::TLS12 # [System.Net.ServicePointManager]::SecurityProtocol = [System.Net.SecurityProtocolType]::TLS13Option 2: Ignore any SSL certificate validation issues.
If you have a firewall or proxy server that participates in SSL certificate offloading, ignore any SSL certificate issues by adding the following snippet just before the
Invoke-WebRequestcmdlet:# Ignore mismatched SSL certificate add-type @" using System.Net; using System.Security.Cryptography.X509Certificates; public class TrustAllCertsPolicy : ICertificatePolicy { public bool CheckValidationResult( ServicePoint srvPoint, X509Certificate certificate, WebRequest request, int certificateProblem) { return true; } } "@ [System.Net.ServicePointManager]::CertificatePolicy = New-Object TrustAllCertsPolicy
If the application defaults to the system or server default TLS settings, change those default settings within the registry on Windows machines. For details, see Transport Layer Security (TLS) registry settings.
If you need to change the default TLS/SSL protocol used by a .NET application, follow the guidance in Transport Layer Security (TLS) best practices with the .NET Framework.
Troubleshoot setup or configuration of Application Insights SDK or agent
If sending telemetry from your application's host machine by using PowerShell or curl is successful, missing telemetry is likely due to setup or configuration issues of the Application Insights SDK or agent. Enable Application Insights monitoring for your application host and programming language to verify that all your configurations or code follow proper guidance and examples.
If tests performed by using PowerShell or curl fail to send telemetry to the ingestion endpoint, verify a few common client-side related issues that may contribute to the problem:
- DNS on your network fails to resolve the ingestion endpoint to the correct IP address.
- TCP connection from your application server to the ingestion endpoint may be blocked by firewalls or gateway devices.
- The ingestion endpoint that the SDK connects to may require TLS 1.2, but your application may by default use TLS 1.0 or TLS 1.1.
- You may have more than one Azure Monitor Private Link impacting your private network, which may overwrite your DNS entries to resolve the ingestion endpoint to the wrong private IP address.
Contact us for help
If you have questions or need help, create a support request, or ask Azure community support. You can also submit product feedback to Azure feedback community.