Dump files in the Visual Studio debugger
A dump file is a snapshot that shows the process that was executing and modules that were loaded for an app at a point in time. A dump with heap information also includes a snapshot of the app's memory at that point.
Opening a dump file with a heap in Visual Studio is something like stopping at a breakpoint in a debug session. Although you can't continue execution, you can examine the stacks, threads, and variable values of the app at the time of the dump.
Dumps are mostly used to debug issues from machines that developers don't have access to. You can use a dump file from a customer's machine when you can't reproduce a crash or unresponsive program on your own machine. Testers also create dumps to save crash or unresponsive program data to use for more testing.
The Visual Studio debugger can save dump files for managed or native code. It can debug dump files created by Visual Studio or by other apps that save files in the minidump format.
Requirements and limitations
- To debug dump files from 64-bit machines, Visual Studio must be running on a 64-bit machine.
- Visual Studio can debug dump files of managed apps from Linux OS.
- Visual Studio can debug dump files of native apps from ARM devices. It can also debug dumps of managed apps from ARM devices, but only in the native debugger.
- To debug kernel-mode dump files or use the SOS.dll debugging extension in Visual Studio, download the debugging tools for Windows in the Windows Driver Kit (WDK).
- Visual Studio can't debug dump files saved in the older, full user-mode dump format. A full user-mode dump is not the same as a dump with heap.
- Debugging dump files of optimized code can be confusing. For example, compiler inlining of functions can result in unexpected call stacks, and other optimizations might change the lifetime of variables.
Dump files with or without heaps
Dump files may or may not have heap information.
Dump files with heaps contain a snapshot of the app's memory, including the values of variables, at the time of the dump. Visual Studio also saves the binaries of loaded native modules in a dump file with a heap, which can make debugging much easier. Visual Studio can load symbols from a dump file with a heap, even if it can't find an app binary.
Dump files without heaps are much smaller than dumps with heaps, but the debugger must load the app binaries to find symbol information. The loaded binaries must exactly match the ones running during dump creation. Dump files without heaps save the values of stack variables only.
Create a dump file
While you're debugging a process in Visual Studio, you can save a dump file when the debugger has stopped at an exception or breakpoint.
With Just-In-Time Debugging enabled, you can attach the Visual Studio debugger to a crashed process outside of Visual Studio, and then save a dump file from the debugger. See Attach to running processes.
To save a dump file:
While stopped at an error or breakpoint during debugging, select Debug > Save Dump As.
In the Save Dump As dialog, under Save as type, select Minidump or Minidump with Heap (the default).
Browse to a path and select a name for the dump file, and then select Save.
Note
You can create dump files with any program that supports the Windows minidump format. For example, the Procdump command-line utility from Windows Sysinternals can create process crash dump files based on triggers or on demand. See Requirements and limitations for information about using other tools to create dump files.
Open a dump file
In Visual Studio, select File > Open > File.
In the Open File dialog, locate and select the dump file. It will usually have a .dmp extension. Select OK.
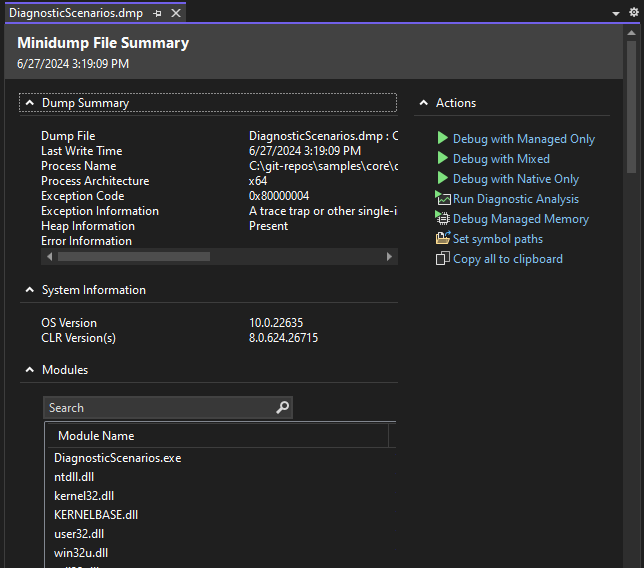
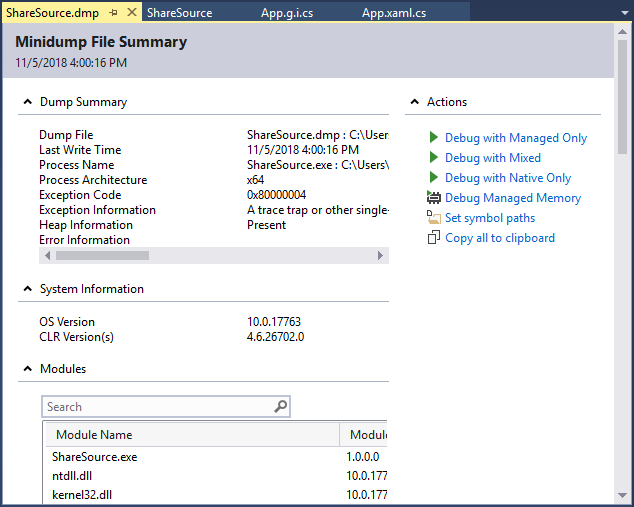
The Minidump File Summary window shows summary and module information for the dump file, and actions you can take.


Under Actions:
- To set symbol loading locations, select Set symbol paths.
- To start debugging, select Debug with Managed Only, Debug with Mixed, Debug with Native Only, or Debug Managed Memory. To analyze managed memory, see Managed type reports.
- To get memory analysis on the dump, select Run Diagnostic Analysis and see Debug a managed memory dump with .NET Diagnostic Analyzers.
Find .exe, .pdb, and source files
To use full debugging features on a dump file, Visual Studio needs:
- The .exe file the dump was created for, and other binaries (such as DLLs) that the dump process used.
- Symbol (.pdb) files for the .exe and other binaries.
- The .exe and .pdb files that exactly match the version and build of the files at dump creation.
- Source files for the relevant modules. You can use the disassembly of the modules if you can't find the source files.
If the dump has heap data, Visual Studio can cope with missing binaries for some modules, but it must have binaries for enough modules to generate valid call stacks.
Search paths for .exe files
Visual Studio automatically searches these locations for .exe files that aren't included in the dump file:
- The folder that contains the dump file.
- The module path the dump file specifies, which is the module path on the machine that collected the dump.
- The symbol paths specified in Tools (or Debug) > Options > Debugging > Symbols. You can also open the Symbols page from the Actions panel of the Dump File Summary window. On this page, you can add more locations to search.
Use the No Binary, No Symbols, or No Source Found pages
If Visual Studio can't find the files it needs to debug a module in the dump, it shows a No Binary Found, No Symbols Found, or No Source Found page. These pages provide detailed information about the cause of the issue, and provide action links that can help you locate the files. See Specify symbol (.pdb) and source files.