 Visual Studio 2022 release notes
We're excited to announce the availability of Visual Studio 2022 v17.13. This update focuses on stability and security, along with continuous improvements for all developers.
Features
Feature list for 17.13 which was released on February 11, 2025.
Productivity
AI-enhanced Feature Search
You can now ask GitHub Copilot to get detailed responses for your queries.
Ever find yourself needing to locate a specific menu item, command, or option in Visual Studio, but you don't know its name or location? Would you benefit from more details on how to use it properly?
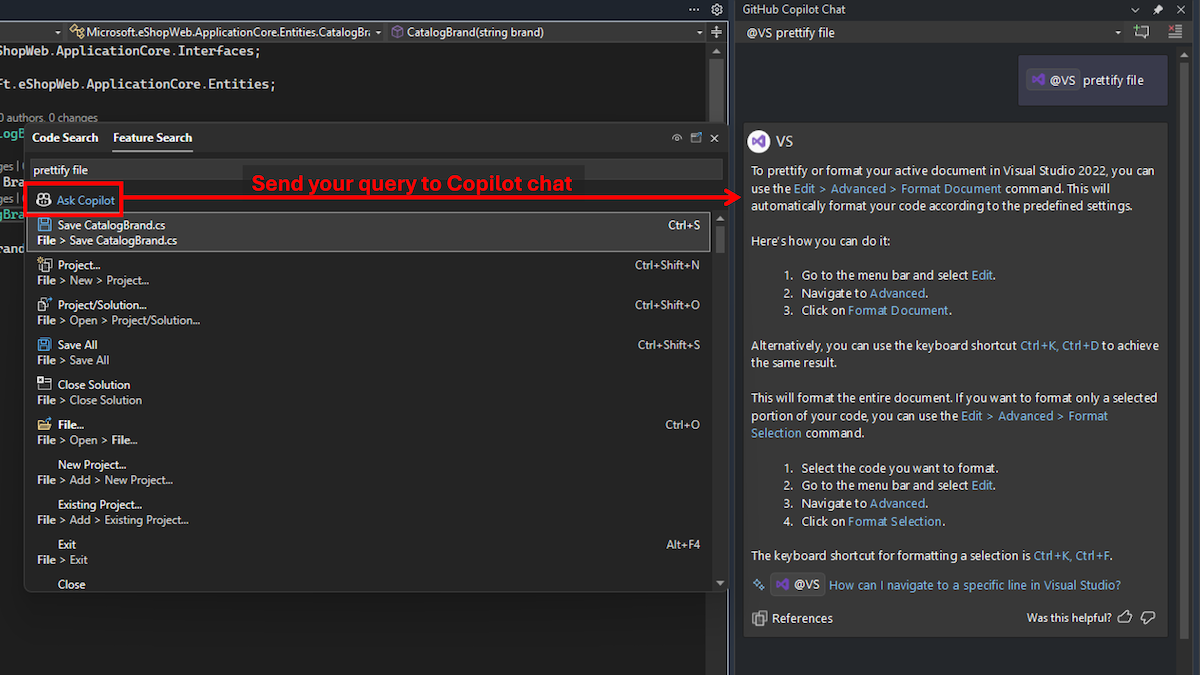
Now, in Feature Search, you can send your query to Copilot Chat to get a detailed response. If you're unsure of the specific terminology for a feature, Copilot Chat can interpret the semantic meaning of your query, consider your Visual Studio version, and provide an answer without having to leave the IDE.
For example, searching for 'prettify file' in Feature Search today won't surface the correct setting 'format document'. But Copilot Chat can identify and explain the relevant items in Visual Studio.
If your Copilot subscription is set up in Visual Studio, you can simply start typing your search into Feature Search and then click the Ask Copilot button to send it to chat.
This integration streamlines your workflow by providing immediate, context-aware assistance directly within the IDE.
Customize file encoding 📣
Specify the default encoding for saving files in Visual Studio.
Developers working in cross-platform environments often need files to be saved with specific file encodings. Changing these encodings can lead to various issues.
Visual Studio now allows you to set the default file encoding for saving files. This feature ensures that your preferred encoding is used whenever possible.
To set the default encoding, navigate to Tools → Options → Environment → Documents. There, you will find an option titled Save files with a specific encoding. If this option is unchecked, Visual Studio will manage file encoding using its default behavior. If checked, Visual Studio will use the encoding specified in the adjacent combo box whenever a file is saved.
If Visual Studio cannot save with the specified encoding (e.g., requesting ASCII encoding for a file containing Unicode characters), it will display a dialog informing you of the issue.
📣 See feature ticket to share your feedback and continue the conversation.
Reimagine the horizontal scrollbar 📣
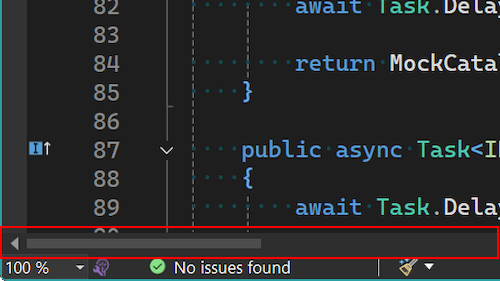
The horizontal scrollbar in the editor now repositions itself to always be accessible, even when space is limited.
The editor tray in Visual Studio is a valuable space for a wealth of information. You can control your zoom, check the health of your document, see what line you're on, and access a variety of additional information.
Unfortunately, sometimes all of that information can crowd out the horizontal scrollbar, making it difficult to scroll through your window. This is particularly true in a side-by-side view where the system tray isn't very wide.
With this latest update, these struggles are a thing of the past. If the scrollbar drops below a usable width, it will reposition itself above the system tray to ensure it's always accessible. By default, it will return to the editor tray as soon as there's enough room for it again.
While we believe this behavior will be ideal for most users, if you encounter any issues, you can control the behavior in Tools → Options. The option is located under Text Editor → Advanced and is labeled Editor horizontal scrollbar location. This setting allows you to choose whether the scrollbar adjusts its position according to the available space, stays in the editor tray, or always appears above the editor tray.
📣 See feature ticket to share your feedback and continue the conversation.
Choose whether to indent word wrap 📣
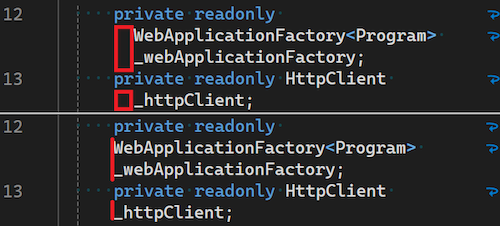
You can now specify whether lines that wrap in the editor should be indented.
We are excited to introduce a new feature that allows you to control whether wrapped lines are indented in the editor. This enhancement provides greater flexibility and customization for your coding environment, ensuring that your code appears exactly as you prefer.
To change this option, follow these steps:
- Go to Tools → Options → Text Editor → General.
- Look for the option called Automatically indent when word wrap is enabled.
By default, this option is enabled, meaning that wrapped lines will be indented. If you prefer your wrapped lines not to be indented, simply uncheck this option. This setting can help improve readability and maintain the desired formatting of your code, especially in projects where indentation style is crucial.
We hope this new feature enhances your productivity and makes your coding experience more enjoyable.
📣 See feature ticket to share your feedback and continue the conversation.
Navigate to recent files in Code Search 📣
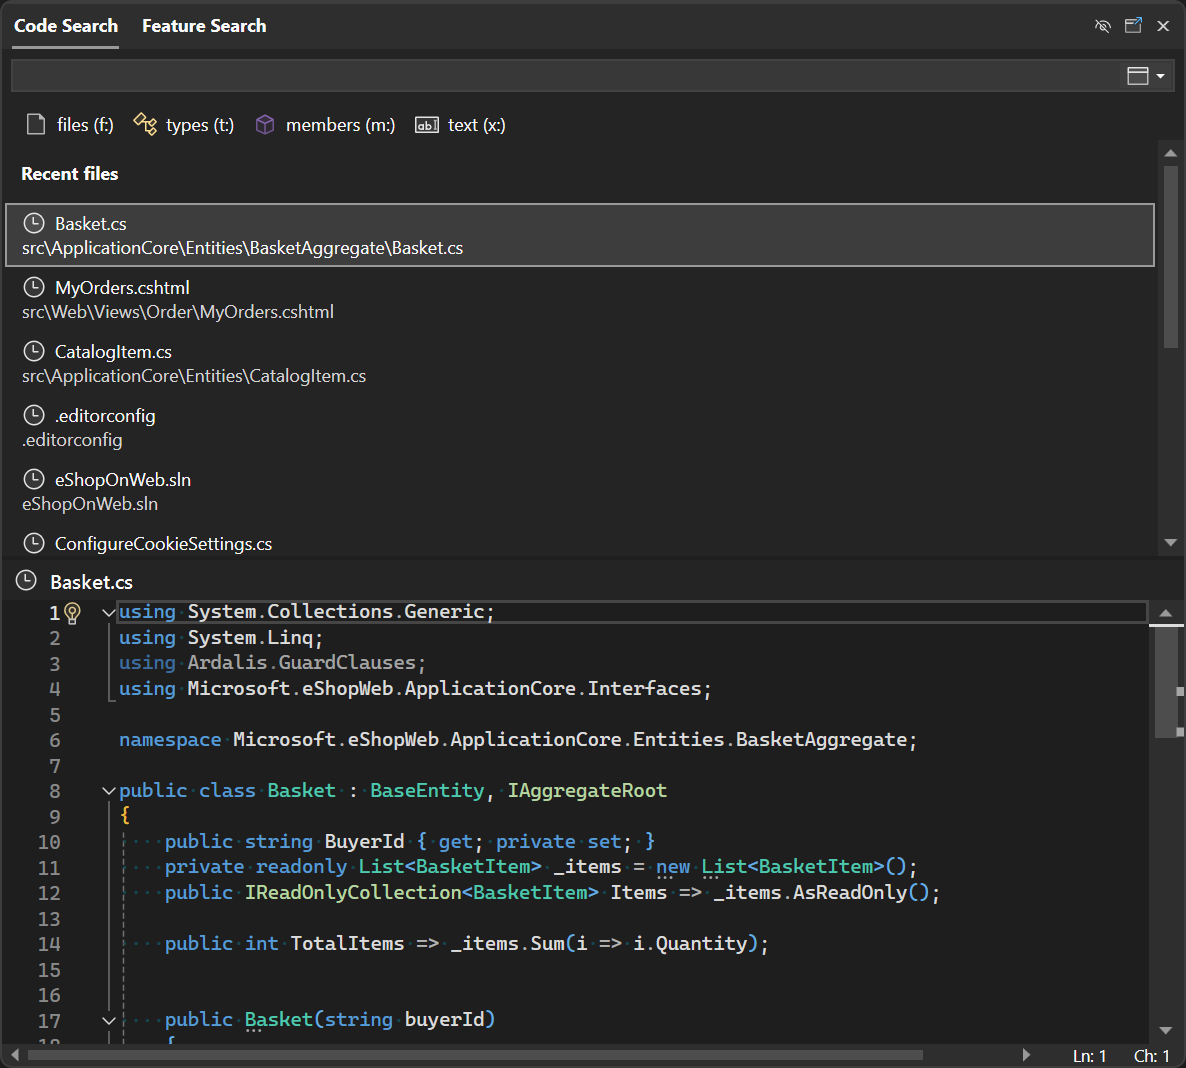
In Code Search, you can now easily jump between your recent files.
We're making it even easier to navigate around your codebase.
Now, when you open Code Search without a query, you'll see a list of your recently navigated files. These include the files you opened through Code Search, but also any other files you opened in the solution. This makes it easy to jump back to a file you were recently working on without having to remember or type the file name.
📣 See feature ticket to share your feedback and continue the conversation.
Enhanced line & column navigation 📣
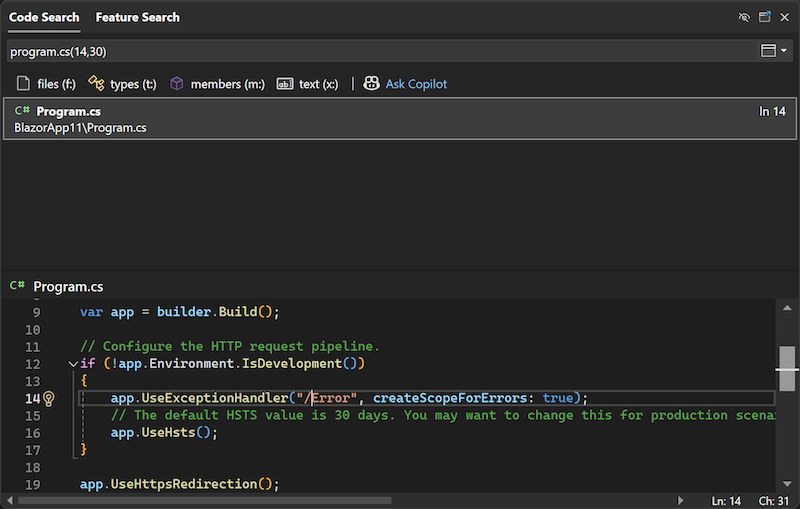
Visual Studio now supports advanced line and column navigation in Code Search.
In Code Search, we've significantly enhanced line navigation capabilities. The following formats are now supported:
:lineto navigate to a specific line in the active document:line,colto navigate to a specific line and column in the active documentfile:lineto navigate to a specific line in a specified filefile:line,colto navigate to a specific line and column in a specified filefile(line)to navigate to a specific line in a specified filefile(line,col)to navigate to a specific line and column in a specified file
These improvements make it easier to quickly locate and edit code, enhancing your productivity and streamlining your workflow.
📣 See feature ticket to share your feedback and continue the conversation.
GitHub Copilot
Code Referencing for GitHub Copilot Completions
Introducing code referencing for GitHub Copilot Completions, providing more transparency and detailed information on public code matches in code completions.
We're excited to announce that code referencing is now available in GitHub Copilot Completions within Visual Studio, a feature previously introduced in GitHub Copilot Chat!
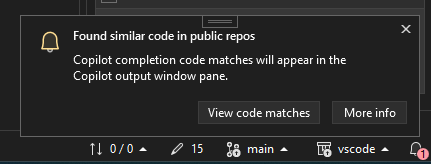
This new functionality offers developers greater transparency on their code completions (or gray text) by providing detailed information on any public code matches found. When you accept a completion that matches code in a public GitHub repository for the first time in your solution, a toast notification will appear on the bottom right of your editor.
All public code match details will be available in your GitHub Copilot Output Window, including the license type and a link to the GitHub.com, the public repository where the original code is located.
Now, just like with GitHub Copilot Chat, you can code with more transparency and confidence using GitHub Copilot Completions!
If you are an individual subscriber and want to manage or learn more about the code referencing setting, see documentation
Important
Activate GitHub Copilot Free and unlock this and other AI features. No trial. No credit card. Just your GitHub account.
Leverage vision in Copilot Chat
Attach images in GitHub Copilot Chat to help you better communicate with your AI pair programmer.
Ever wanted to share an image with your AI pair programmer to help explain a concept or show an example? Now you can! With the new feature, you can attach images in GitHub Copilot chat to help you better communicate exactly what you need.
Important Note
As this feature is in preview, it may not be available to all users. Due to the gradual rollout, you may not see the option to attach images in chat immediately.
Get Started
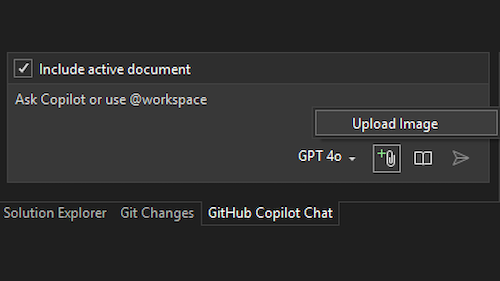
All you need to do is either paste an image from your clipboard or use the paperclip icon in the chat window to upload your image from file explorer. Then, simply add your prompt text and send! Copilot will then analyze the image and use it as additional context to generate a better response. This can be especially useful for tasks like ui development, where outlining a design or layout can be challenging with text alone. By attaching an image, you can help Copilot better understand your vision and generate more accurate code suggestions. It can also be useful when debugging, where you can share a screenshot of an error message or a code snippet to get more accurate suggestions.
The accepted file types are PNG, JPG, and GIF (though, the model will only take a single frame of an animated gif), and you can attach up to 3 images per message. Additionally, several models support vision capabilities, including the GPT-4o model and Claude 3.5 Sonnet.
📣 Take this survey to help make the feature even better.
Important
Activate GitHub Copilot Free and unlock this and other AI features. No trial. No credit card. Just your GitHub account.
GitHub Copilot shortcuts
New keyboard shortcuts for threads in GitHub Copilot Chat.
This update registers new Commands for Copilot and binds them to keyboard shortcuts in the Chat window:
- New thread: Ctrl+N
- Previous thread: Ctrl+PgDown
- Next thread: Ctrl+PgUp
- Expand and focus thread drop-down: Ctrl+Shift+T
Next/Previous thread will cycle around when the first/last item are passed.
Because these are registered as VS commands, they can be customized by users in the Keybinding dialog.
Note: These shortcuts will only work if your active focus is in the Copilot Chat pane. If you're working elsewhere, these shortcuts might have different functions.
Important
Activate GitHub Copilot Free and unlock this and other AI features. No trial. No credit card. Just your GitHub account.
Slash command expansions
Enhance slash commands by expanding into natural language.
Users can now enjoy an enhanced slash command experience. Slash commands expand out into their natural language counterparts as the user types, including pulling in any active context they'll use and displaying that in the user's prompt before they send it.
This provides users with:
- A better understanding of what will happen once they send their prompt
- An understanding of what context the command can use
- The ability to make modifications to the prompt before sending it
After the slash command expands:
Important
Activate GitHub Copilot Free and unlock this and other AI features. No trial. No credit card. Just your GitHub account.
Use GitHub Copilot Edits across files
Iterate across multiple files more efficiently.
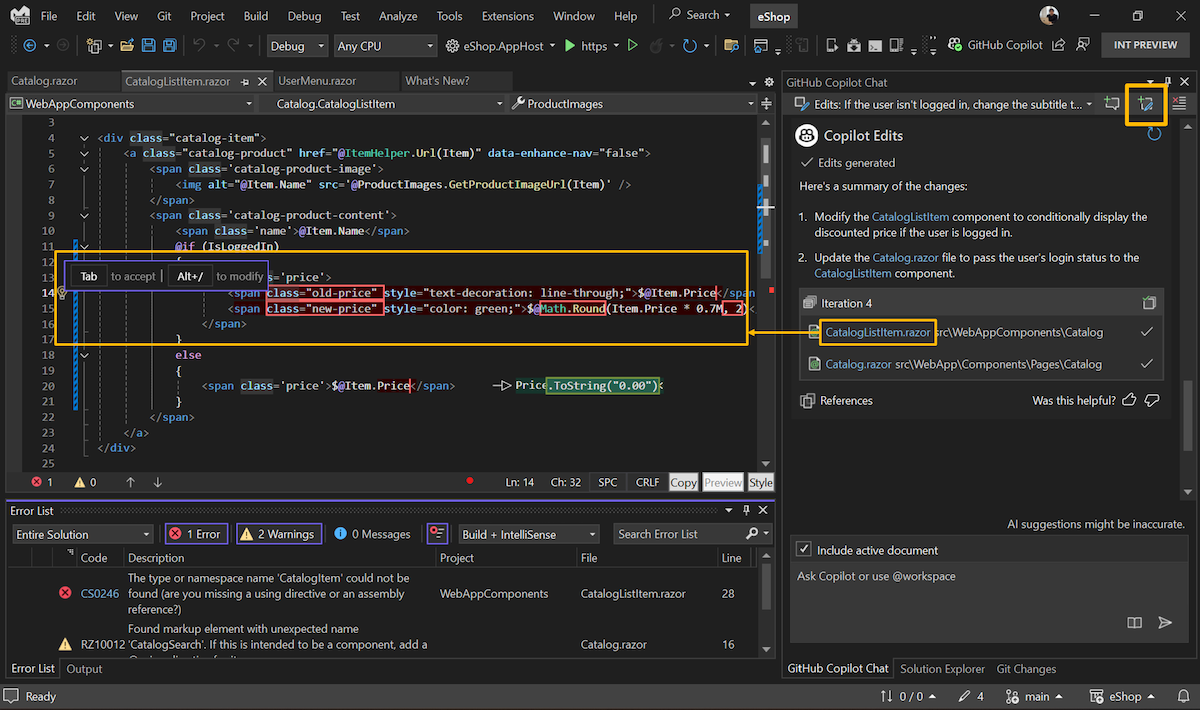
Copilot in Visual Studio now helps you refine your code with Copilot Edits, a feature designed to make iteration across multiple files more efficient.
Start by clicking the button to create an Edits thread at the top of the Copilot Chat panel.
Copilot Edits combines the conversational flow of chat with an inline review experience to help developers:
- Preview with clarity: Copilot Edits starts with a summary of the files affected and the proposed changes, so you know exactly what's happening.
- Review with flow: View code diffs inline, directly in your editor. Accept or reject individual changes using the TAB or Alt+Del keys, or apply/dismiss all at once.
- Iterate with confidence: Checkpoints let you revisit earlier iterations of a code file or try a different approach whenever you need to—perfect for when inspiration strikes again.
Get started by describing the changes you'd like in natural language, and reference specific files, errors, or your solution using the # key, just as you already do in Copilot Chat.
Important
Activate GitHub Copilot Free and unlock this and other AI features. No trial. No credit card. Just your GitHub account.
Meet GitHub Copilot Free
Copilot Free is now available. You get 2,000 code completions and 50 chat requests per month at no cost, all seamlessly integrated into Visual Studio.
I'm your AI pair programmer 🎉
GitHub Copilot Free gives you:
✅ 2,000 code completions per month
✅ 50 chat messages per month
💸 No trial. No credit card required. Just your GitHub account.
Unlock the Power of GitHub Copilot
Ready to elevate your coding experience? Sign up for Copilot Free in the Chat Window now and enjoy the benefits:
💡 Get instant suggestions and completions to accelerate your development.
🛠️ Use natural language prompts for AI-driven edits across multiple files directly in your editor.
🔍 Easily navigate and understand your projects with our intuitive chat feature.
All with tailored suggestions that match your coding style and project needs.
✨ Happy coding!
The GitHub Copilot and Visual Studio team
Important
Activate GitHub Copilot Free and unlock this and other AI features. No trial. No credit card. Just your GitHub account.
Function Calling in GitHub Copilot
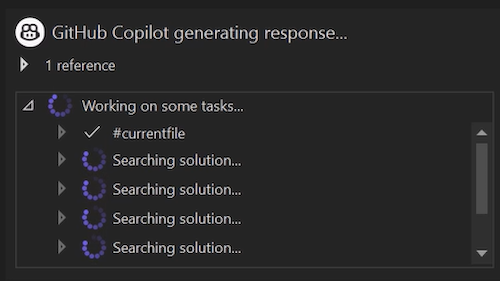
Copilot Chat just got smarter! With Function Calling, you no longer need to manually specify the context for Copilot to understand your code. Now, Copilot automatically search for the relevant information.
Copilot Chat just got smarter! With Function Calling, you no longer need to manually specify the context for Copilot to understand your code. Now, Copilot automatically search for the relevant context, including:
- Your current file
- Open or related files
- Your entire codebase
- Debugger data (locals, call stacks, exceptions etc.)
- Visual Studio tools
Simply describe what you need in natural language, and Copilot retrieves relevant files and understands your project's nuances. It even considers language-specific details like project type and target frameworks for better suggestions.
Important
Activate GitHub Copilot Free and unlock this and other AI features. No trial. No credit card. Just your GitHub account.
Debugging & diagnostics
Smarter Exception and Variable Analysis
Exception and Variable Analysis leverage project context for more accurate error resolution.
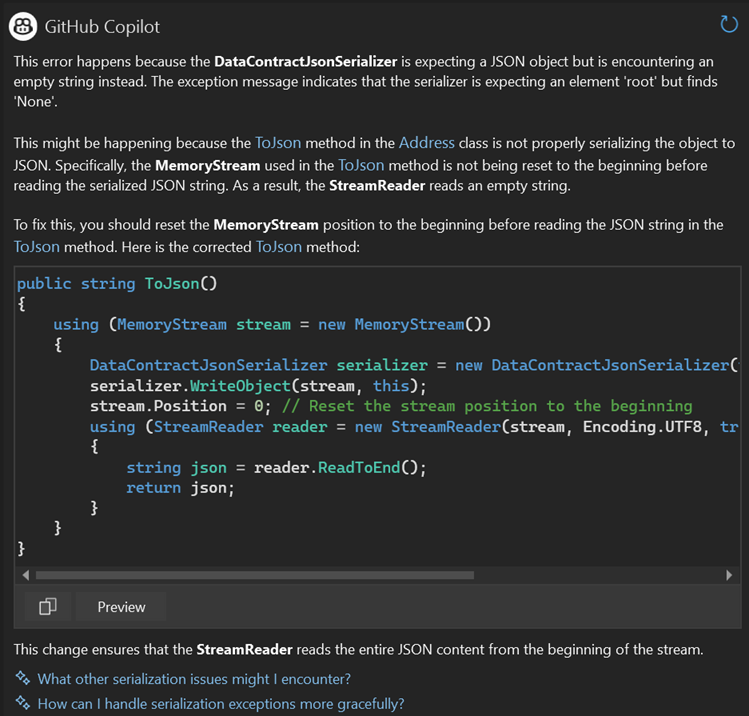
GitHub Copilot Exception Analysis and Variable Analysis now intelligently leverage your project context to identify and highlight relevant code contributing to errors.
By offering sharper, actionable insights and smarter, context-aware solutions, these features can help you resolve issues faster, streamline your debugging workflow, and improve overall accuracy in error troubleshooting.
Copilot Chat Integration in Parallel Stacks
Enhance the debugging process with copilot integration in Parallel Stacks.
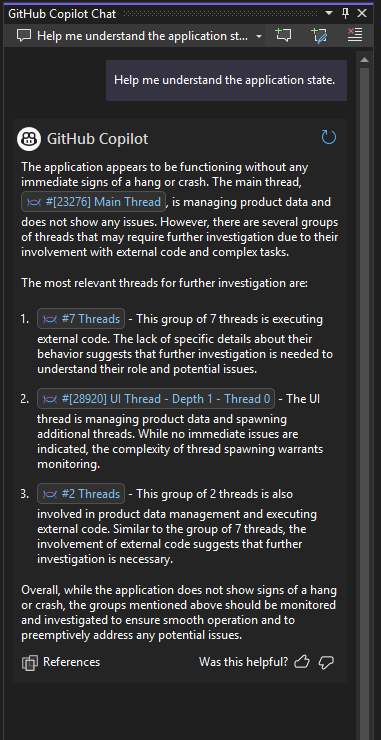
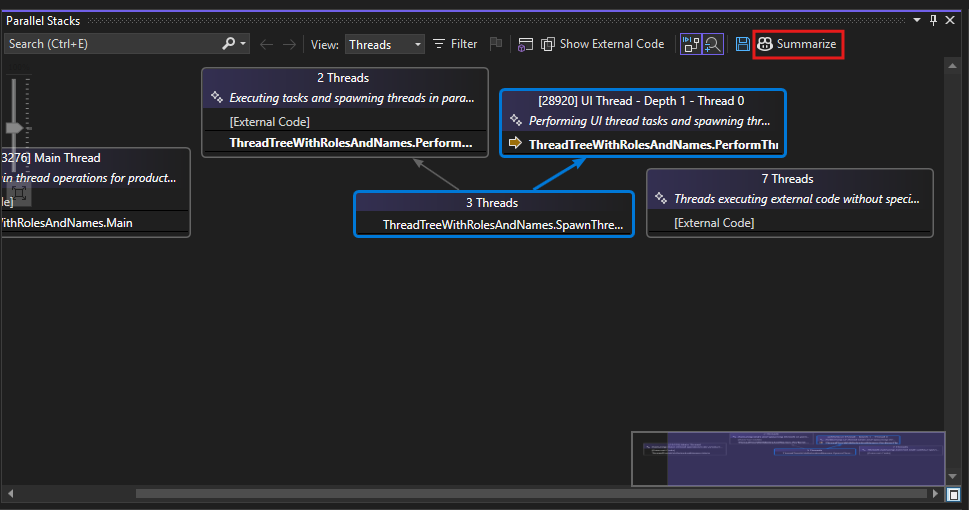
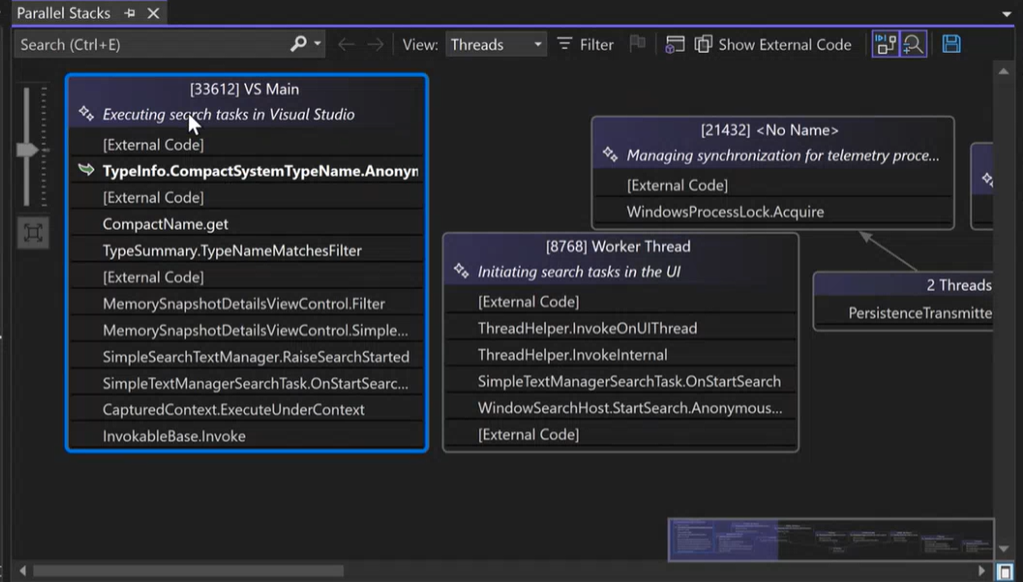
Visual Studio now offers an enhanced debugging experience with Copilot Chat Integration in the Parallel Stacks window. This feature allows you to quickly gain context and insights about each thread's activity. Instead of just presenting raw call stacks, this integration leverages GitHub Copilot's AI-driven summarization to provide clear overviews of each thread's actions, potential issues, and fixes. This results in a more intuitive approach to multi-threaded debugging, significantly reducing the time needed to understand and resolve complex thread interactions.
To use this feature, simply click the Summarize button at the top of the Parallel Stacks window. This will open the Copilot Chat on the side, preloaded with relevant thread context. You can then explore deeper details, including thread states, function calls, and suggested fixes—all through an interactive, AI-powered conversation. By seamlessly combining parallel stack insights with Copilot Chat's auto-generated summaries, Visual Studio streamlines your debugging workflow, empowering you to diagnose, understand, and address threading issues with greater confidence and speed.
Try it today and experience streamlined debugging with the latest AI-powered tools in Visual Studio!
Highlight syntax with IEnumerable Visualizer
Enhanced editable expression with syntax highlighting is now available.
Writing LINQ expressions can get tricky, especially as they grow complex. Visual Studio 2022 now introduces syntax highlighting in the IEnumerable Visualizer Editable Expression.
Syntax highlighting applies different colors to specific parts of your queries, such as classes, enums, delegates, structures, and keywords. This makes it simple to spot various components in your LINQ expressions and see the logical flow at a glance, leading to clearer, more maintainable code.
Customize syntax highlighting
Visual Studio allows you to customize the color scheme to suit your preferences. To personalize your colors:
- Go to Tools → Options → Environment → Fonts and Colors.
- Select Text Editor from the Show settings for dropdown.
- Adjust each User Types item's color to match your coding style.
Streamline debugging for native code
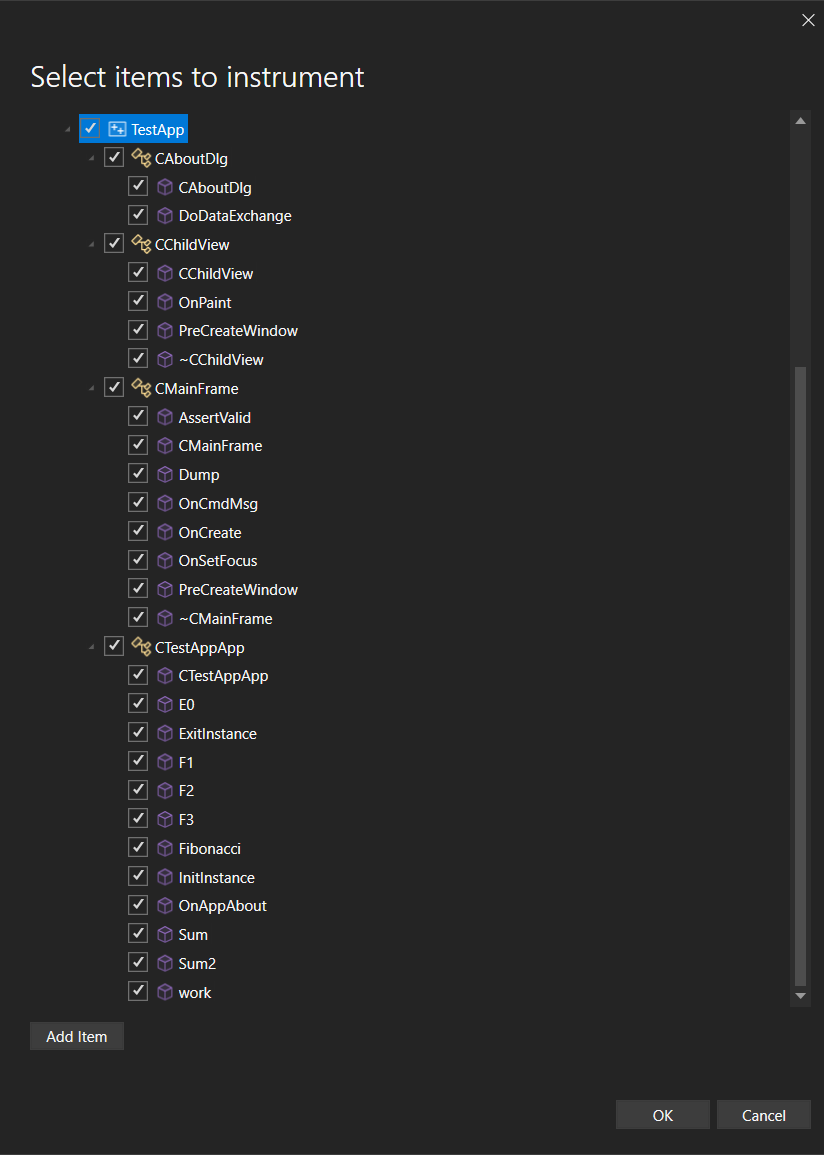
The Visual Studio profiler's instrumentation tool now supports targeted instrumentation for native code.
The Visual Studio profiler's instrumentation tool now supports targeted instrumentation for native code, allowing you to select specific classes and functions for detailed analysis.
This feature enhances performance monitoring and helps pinpoint issues more efficiently, streamlining your debugging process.
This precision allows for deeper insights into performance bottlenecks and accelerates your profiling efforts.
Thread summaries in Parallel Stacks
Enhance the debugging process with AI thread summaries in Parallel Stacks.
Debugging complex, multi-threaded programs is now more efficient with the GitHub Copilot Auto-Summarize feature in the Parallel Stacks window. This enhancement delivers clear, concise thread summaries, making it easier to trace issues and understand thread behavior at a glance.
When using Copilot in Visual Studio, you'll see a new AI-generated summary row at the top of each thread in the Parallel Stacks window. These summaries provide a high-level overview of each thread's current activity, helping you quickly grasp their purpose and status.
This feature is designed to save you time and effort by presenting essential thread information in an intuitive, readable format, enabling you to focus on solving problems rather than untangling complex thread structures.
Try it today and experience streamlined debugging with the latest AI-powered tools in Visual Studio!
Craft complex LINQ queries 📣
Enhanced editable expression with GitHub Copilot Inline Chat directly in the IEnumerable Visualizer.
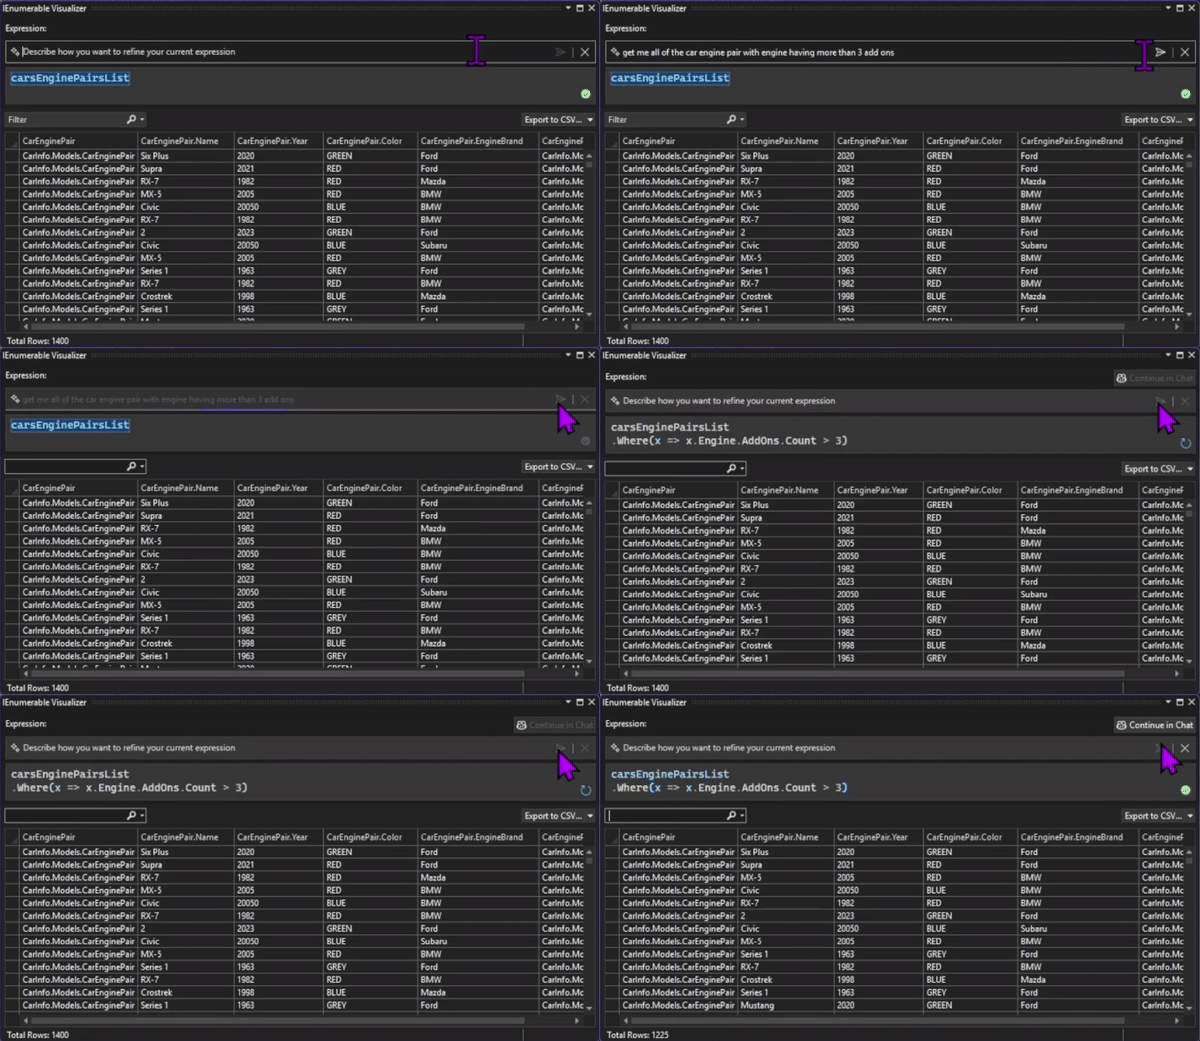
The IEnumerable Visualizer now features inline chat for its editable expression, enabling users to leverage AI directly within the IEnumerable Visualizer to craft complex LINQ queries for the editable expression.
Editable Expression Inline Chat
To bring up the inline chat, simply click the GitHub Copilot sparkle button located in the bottom-right corner of the editable expression text box. This will open a text box above the original editable expression, with a prompt that says Describe how you want to refine your current expression. Enter your request in natural language, and once you're ready, click the Submit button.
GitHub Copilot will generate a LINQ query based on your input and automatically execute it by default. To confirm that the query has been successfully generated and applied, look for the green checkmark, which indicates that the LINQ query generated by GitHub Copilot has been fully executed and applied.
Continue to GitHub Copilot Chat
The feature also includes a Continue in Chat button after at least one LINQ query has been generated by GitHub Copilot, conveniently located at the top-right corner of the text box.
Clicking this button opens a dedicated GitHub Copilot Chat window where you can refine your query, ask follow-up questions, or explore alternative approaches in more detail. This integration ensures you maintain control and flexibility while leveraging the full capabilities of GitHub Copilot.
When you're ready to return to the visualizer, simply click the Show in Visualizer button. This allows you to seamlessly transition back to the visualizer environment, where you can view or apply the changes generated during your chat session.
This feature provides a fluid workflow between the visualizer and GitHub Copilot Chat. The inline chat is optimized for quick edits and small adjustments, while the GitHub Copilot Chat excels at handling more detailed refinements and iterative improvements, both of which aim to make generating LINQ queries for editable expression easier and more efficient.
📣 See feature ticket to share your feedback and continue the conversation.
Display unified async stacks in profiler
The Visual Studio profiler unifies async stacks for streamlined .NET profiling.
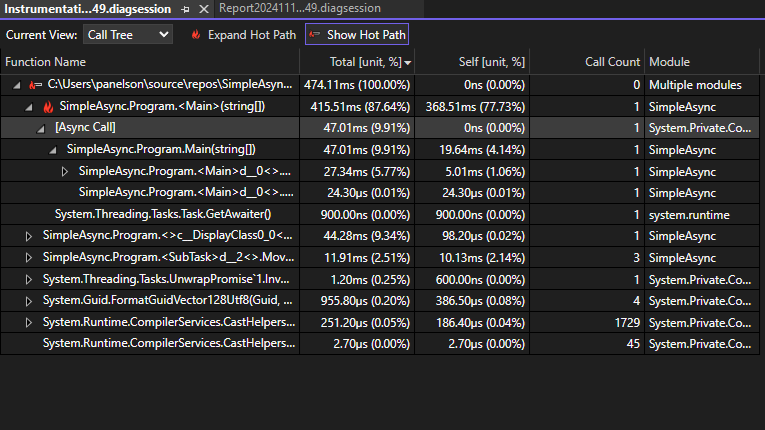
The Visual Studio profiler now enhances debugging for .NET applications by displaying stitched async stacks in both the summary and detail call tree views.
This feature provides a clearer, more cohesive view of asynchronous operations, allowing developers to trace the full execution flow, including asynchronous method calls, all within a single, unified stack trace.
By eliminating the need to manually piece together separate async call paths, this improvement helps you quickly identify performance bottlenecks and troubleshoot issues more efficiently.
Use color-coded swim lanes for CPU profiling
The Visual Studio profiler enables multiprocess CPU analysis with color-coded graphs and filtering.
The Visual Studio profiler's CPU Usage tool now supports multiprocess analysis, displaying performance graphs with distinct color coding for each process in swim lanes.
The graphs are displayed as stacked area charts. You also have the option to filter processes using a dropdown on the top left, enabling focused analysis.
This improvement allows you to easily distinguish and analyze CPU utilization across processes within a single session. By providing clearer insights into resource consumption, it enhances profiling efficiency and streamlines performance optimization for multiprocess applications.
Git tooling
Add comments on pull requests 📣
Review pull requests in Visual Studio by adding new comments to the files on the checked-out branch.
With the latest update, you can now add new comments to pull request files on the checked-out branch. This was a top request for the pull request experience and is the latest in a series of improvements to the pull request experience in Visual Studio.
Get Started
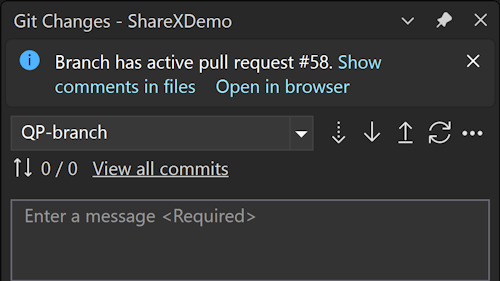
Enable the feature flags Pull Request Comments and Pull Request Add Comment, check out any branch with an active pull request, and select Show comments in files in the InfoBar. This will activate the pull request comments experience in the editor.
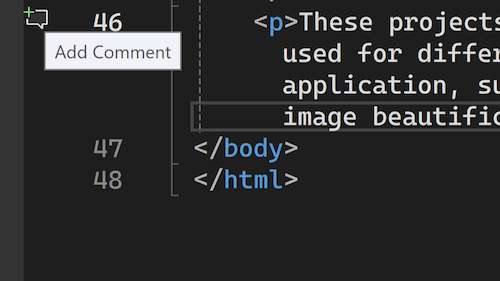
To add a new comment to a file, select the Add Comment icon in the margin, or right-click the line you'd like to add a comment on and choose Git → Add Comment from the context menu.
Note: The icon will show only in files that are part of the pull request. For GitHub pull requests, you'll only be able to comment on lines surrounding and including the lines that have been changed.
📣 See feature ticket to share your feedback and continue the conversation. And take this survey to help make the feature even better.
Catch issues at commit time 📣
Get GitHub Copilot-powered suggestions for your code changes to help you catch potential issues early and improve your code quality.
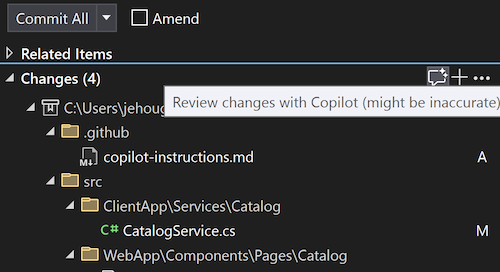
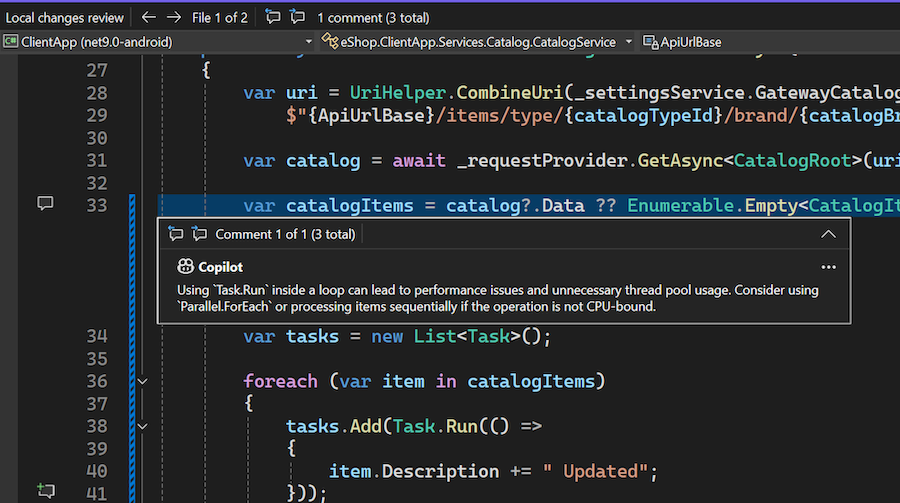
Now, you can get a GitHub Copilot code review on your local changes before you even commit! With your Copilot subscription enabled in Visual Studio and the following feature flags enabled, you can see the new sparkle comment button in the Git Changes window. When clicked, Copilot will examine your sets of changes and propose some suggestions inline in your editor.
The model can point out critical issues such as potential performance and security problems that, when caught early, help reduce your risk of pushing issues into your remote code base.
Ensure you have both of the following feature flags turned on:
- Tools → Options → Preview Features → Pull Request Comments
- Tools → Options → GitHub → Copilot → Source Control Integration → Enable Git preview features.
📣 See feature ticket to share your feedback and continue the conversation. And take this survey to help make the feature even better.
Note
This feature must be enabled under Tools → Manage Preview Features
View and manage Git tags 📣
Navigate and push Git tags seamlessly from Visual Studio.
With the latest update, Visual Studio empowers you to seamlessly view and manage Git tags directly within the Git Repository window. Effortlessly navigate to the specific commit associated with a tag and access a context menu brimming with actions you can perform on the tag. This streamlined workflow ensures you remain within the familiar environment of the IDE, enhancing your productivity and efficiency when working with Git tags.
📣 See feature ticket to share your feedback and continue the conversation.
IDE
Preserve font preferences across themes 📣
Changing themes will now preserve your font and font size preferences.
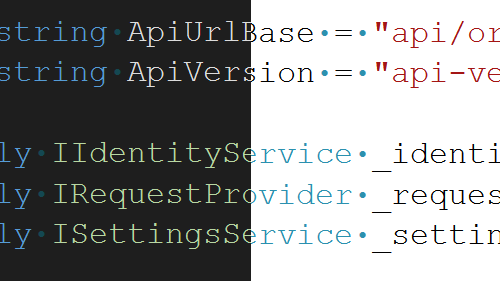
We understand that the fonts developers select when coding is a personal choice, influenced by preferences for readability, accessibility, or aesthetics. Visual Studio themes primarily focus on presentation colors and are independent of your preferred fonts.
With this update, we've introduced functionality to retain your font face and size choices when switching themes. You can now set your font preferences once and switch themes in Visual Studio without needing to reconfigure your font settings every time. Note that the colors of your fonts remain linked to the theme, as that is the purpose of themes, but your font selections will be preserved.
This feature will be enabled by default for all users. If you prefer the previous behavior, go to Tools → Manage Preview Features and find the option Separate font settings from color theme selection. If this option is checked, your font preferences will be maintained regardless of theme changes. Uncheck the box to reinstate the previous behavior which ties font choices to theme.
📣 See feature ticket to share your feedback and continue the conversation.
Onboard a GitHub account
Add GitHub accounts from the first launch wizard or the Visual Studio shell.
Do you need to work with GitHub resources? Adding your GitHub account is now easier than ever!
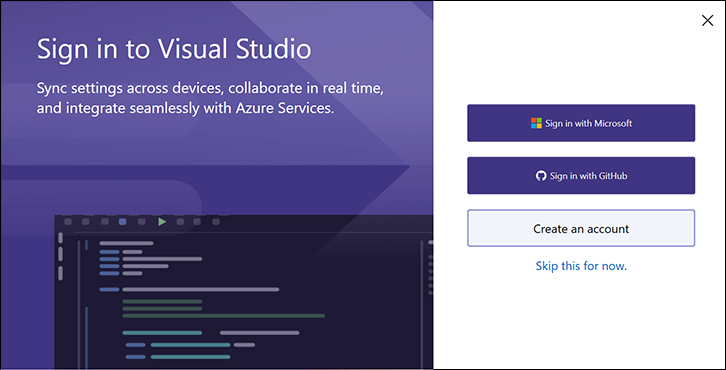
New ways to sign in with your GitHub account
You are now able to sign in with your GitHub account during the first launch configuration dialog:
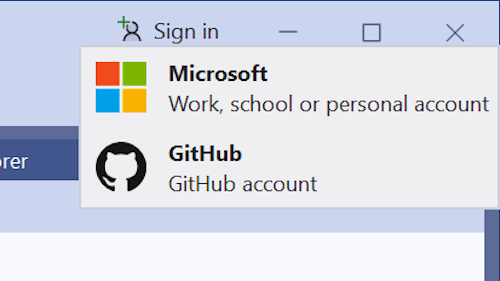
If you decide to skip the first launch account setting, you can also sign in straight from the VS shell without the need to first add a Microsoft account.
Please note that you won't be able to sync your settings until you add a Microsoft (work or school or personal) account to Visual Studio.
Manage multiple GitHub accounts 📣
Add multiple GitHub accounts and set an active account to drive GitHub features like GitHub Copilot and version control.
Do you need to use different GitHub accounts for your development scenarios? Visual Studio now allows you to have multiple GitHub accounts at the same time!
Adding multiple GitHub accounts
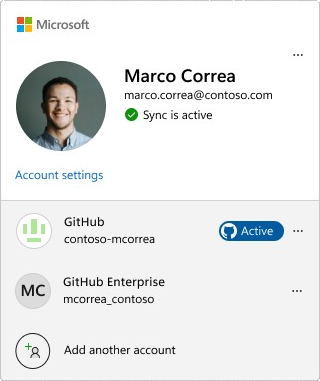
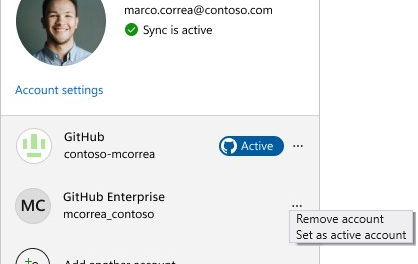
Adding multiple accounts is easy! Simply open the profile card, select Add another account, sign in to your GitHub account, and repeat as needed.
You can also add your accounts from the Account Settings dialog under File → Account Settings.
Setting an active GitHub account
If you add multiple GitHub accounts, Visual Studio will default to the one marked as active for GitHub aware features, such as version control and GitHub Copilot.
To switch the active account, access the account options and select the Set as active account button.
Impact to GitHub Copilot
Copilot activates automatically when the active GitHub account is subscribed to either GitHub Copilot for Individuals or GitHub Copilot for Business.
Impact to version control
When working on GitHub pull requests or issues, you'll get a prompt to set your GitHub account. We'll remember your preferences whenever you work on a particular repository, so when you change repositories, you won't have to worry about switching your accounts for your regular Git operations like push, pull, and fetch. You'll also get prompted to update your active account if there's ever a mismatch to avoid using the wrong account.
📣 See feature ticket to share your feedback and continue the conversation.
Add a new markdown file 📣
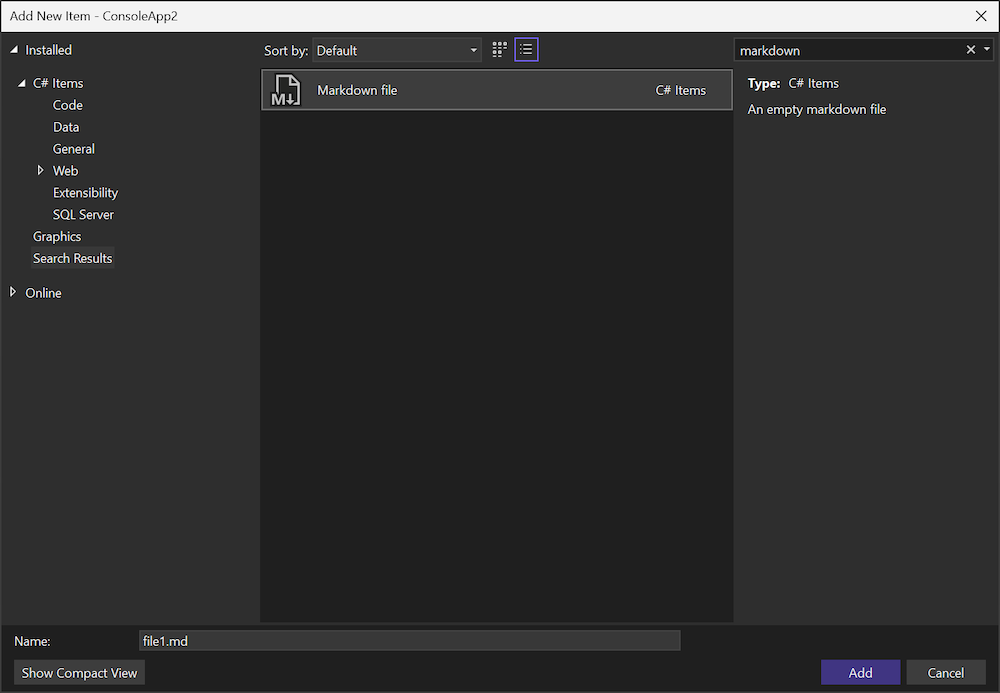
Adding a new markdown file just got easier with the new template available in the Add New Item dialog.
Creating a new markdown file in your project is now simpler with the Markdown file template available in the Add New Item dialog. This template provides a convenient starting point for your markdown content.
To add a new markdown file to your project, follow these steps:
- In Solution Explorer, right-click the project or folder where you want to add the markdown file.
- Select Add → New Item.
- In the Add New Item dialog, select Markdown file.
- Enter a name for the file and click Add.
📣 See feature ticket to share your feedback and continue the conversation.
Check out the new features in the Teams Toolkit
Learn about the Teams Toolkit improvements in the new release.
We're excited to announce the new features added to the Teams Toolkit:
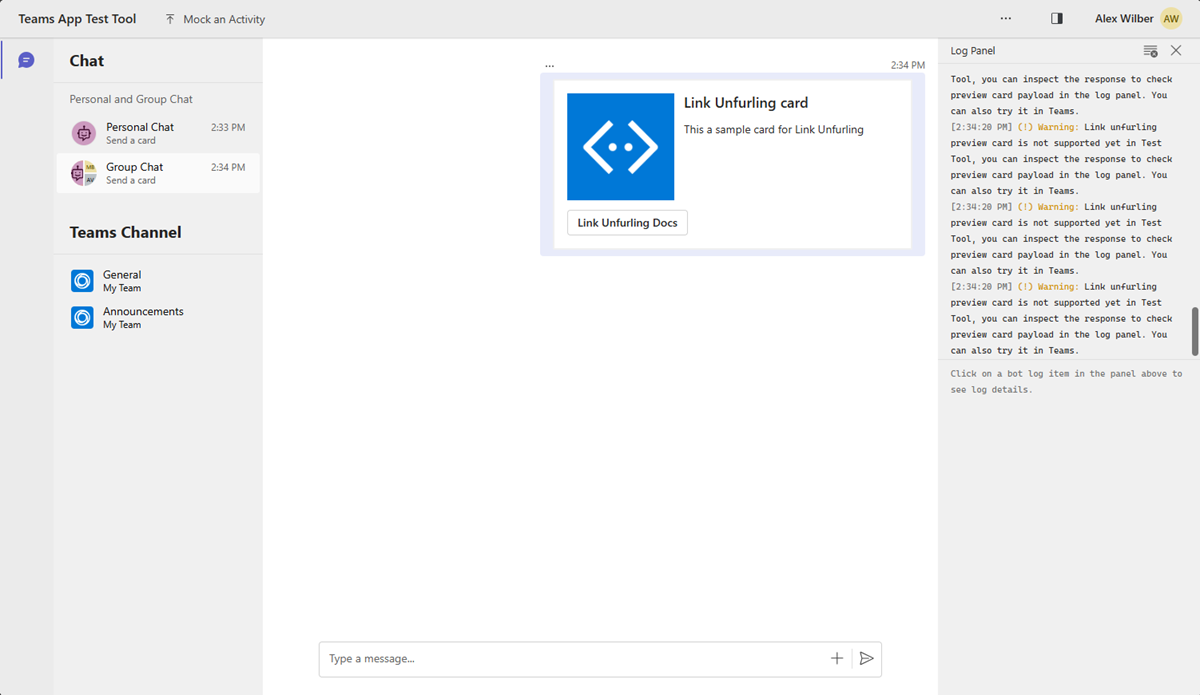
App Test Tool support for Message Extension app
The App Test Tool is an integrated Teams environment for testing Teams apps. Previously, we delivered Tab and Bot support for debugging in the App Test Tool. Now, you can also debug Message Extension apps by simply selecting the App Test Tool option in the debug menu.
AI Bot template upgrade
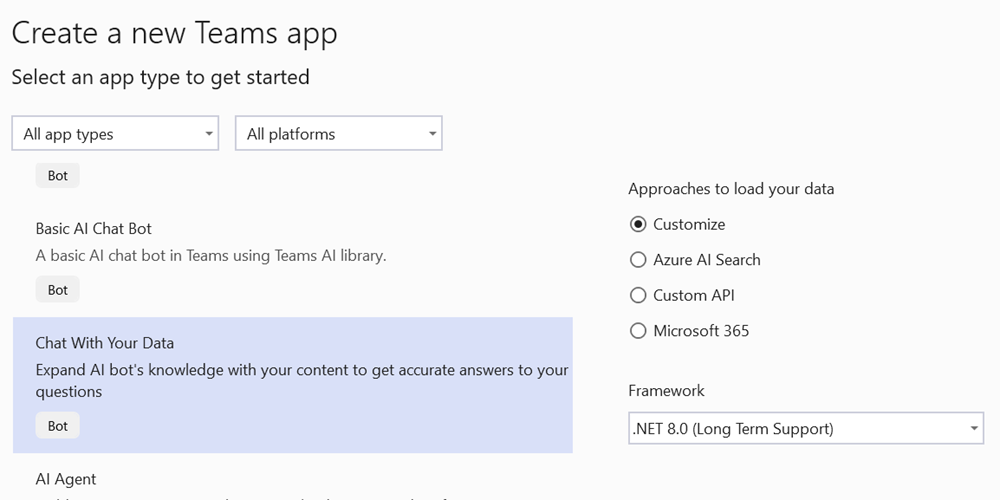
Chat with Your Data is a Teams app template we introduced in a previous release. It allows you to create a Custom Copilot, an AI-powered chatbot with RAG capability that can understand natural language and retrieve domain data to answer domain-specific questions. In this version, we have upgraded the template to add two additional data sources: Custom API and Microsoft 365.
- Custom API: Your chatbot can invoke the API defined in the OpenAPI description document to retrieve domain data from the API service.
- Microsoft 365: Your chatbot can query M365 context data from the Microsoft Graph Search API as a data source in the conversation.
Cloud
Leverage .NET Aspire and Azure Functions
Azure Functions can now use .NET Aspire to integrate serverless technology into .NET Aspire.
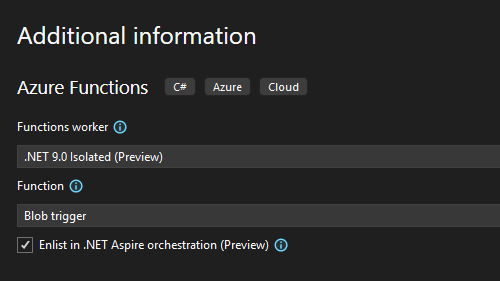
With this release of Visual Studio, Azure Functions developers can now leverage .NET Aspire orchestration when creating a new Azure Functions project. By selecting this option, an App Host and a Service Defaults project will be included in your solution when the Functions project is created.
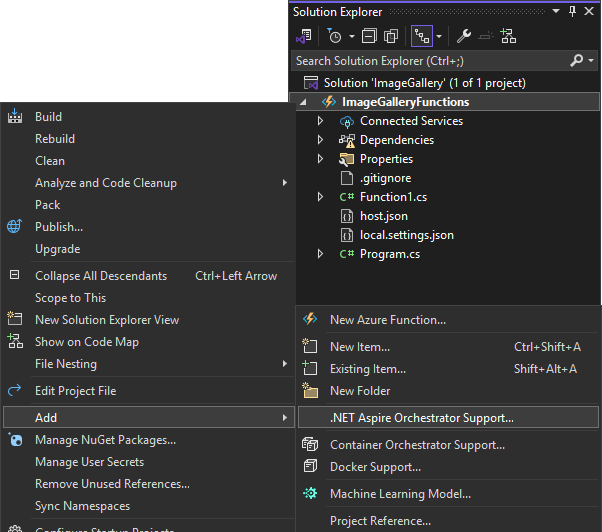
If you have an existing Azure Functions project, such as one integrated with an ASP.NET Core Blazor front-end web app, you can add .NET Aspire support to it, just as you could with ASP.NET Core apps prior to this release.
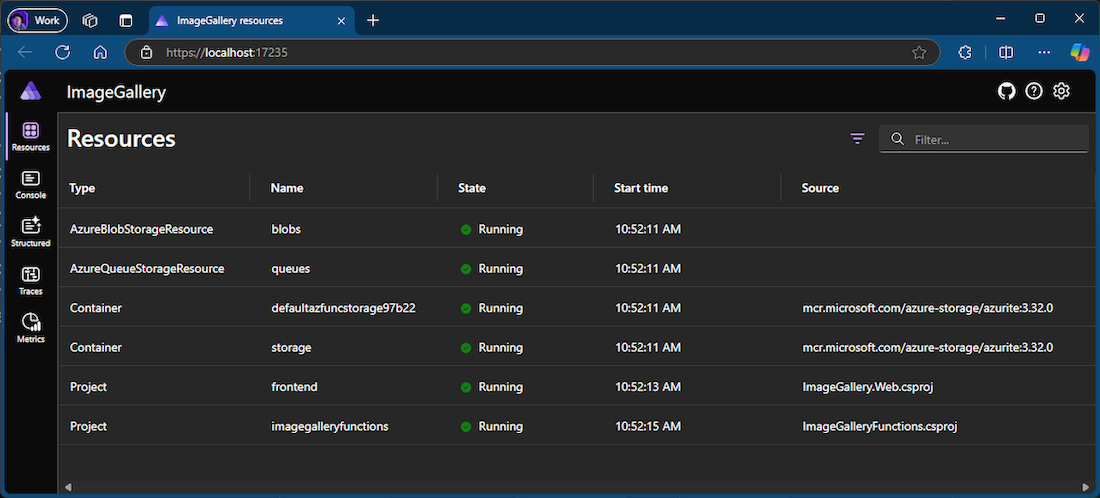
Additionally, running or debugging an Azure Functions project with .NET Aspire support will launch the .NET Aspire dashboard in your browser. This allows you to monitor the execution of your Azure Functions in real-time. You can observe how the .NET Aspire orchestrator manages the execution of your Azure Functions and even pause and resume their execution from the dashboard.
We are excited about this integration and look forward to seeing how you will incorporate Azure Functions into your .NET Aspire projects.
Launch a new Docker configuration 📣
Enable depends_on support with the DependencyAwareStart launch configuration option.
We are excited to introduce a new launch configuration option called
DependencyAwareStart. When set toTrue, this option changes how Docker Compose projects are launched, enabling the use of thedepends_ondirective in your Compose configuration.
This feature ensures that specified containers are started in the correct order, adhering to the dependency requirements defined in your Docker Compose file. By managing dependencies more effectively, it enhances the robustness and reliability of multi-container applications.
📣 See feature ticket to share your feedback and continue the conversation.
Add scale to Docker Compose 📣
The scale property in Docker Compose is now supported.
You can now add the
scaleproperty to your Docker Compose service configuration to debug with a specific number of replicas running. For example, the configuration below will run two instances of thewebapiservice when launched.
This enhancement allows for more effective load testing and debugging of your applications by simulating a production-like environment. It also streamlines your workflow by making it easier to manage multiple instances directly from your Compose file. This feature is particularly useful for testing the behavior of your services under load and ensuring that your application can handle multiple instances seamlessly.
📣 See feature ticket to share your feedback and continue the conversation.
Desktop
New UWP .NET 9 project templates 📣
Visual Studio now includes updated UWP project templates targeting .NET 9 and Native AOT.
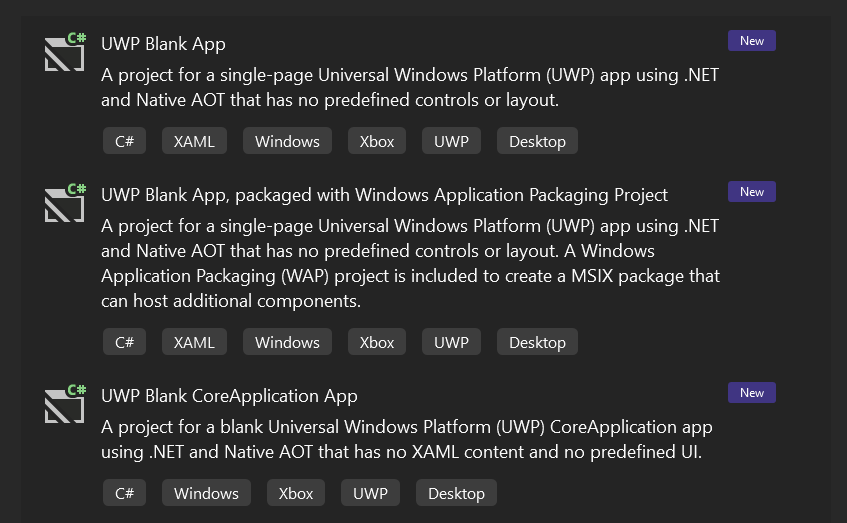
Visual Studio now includes new UWP projects targeting .NET 9 and Native AOT. You can use these new templates to easily create a new UWP XAML or CoreApplication app, a class library, or a WinRT component. This makes it much easier to get started with the new tooling, and to migrate existing UWP apps using .NET Native.
The original UWP project templates using .NET Native will remain available, however it is recommended to use the new project templates targeting .NET 9 and Native AOT going forwards. We have adjusted the ordering of all UWP templates to reflect this, and prioritize the new .NET 9 project templates as well.
📣 See feature ticket to share your feedback and continue the conversation.
Improved MSIX tooling for UWP apps on .NET 9 📣
Visual Studio now references the latest release of the standalone single project MSIX tooling to package UWP apps on .NET 9.
All UWP projects targeting .NET 9 have been updated to the latest 1.2 release of the single project MSIX package (Microsoft.Windows.SDK.BuildTools.MSIX). This includes several improvements and bug fixes compared to its previous version, such as:
- Support for creating MSIX bundles
- Fixed an issue producing PRI resources when using WAP (.wapproj) projects
- Fixed fast up to date checks for embedded PRI resources
- MSBuild tasks logging is now less verbose and more informative
As always, you can also opt-in to never or preview versions of the MSIX package manually, by setting the
WindowsSdkBuildToolsMSIXPackageVersionproperty in your .csproj file, if needed.📣 See feature ticket to share your feedback and continue the conversation.
Improved .NET 9 SDK support for UWP 📣
Visual Studio now includes the latest .NET 9 SDK improvements for UWP out of the box.
This new release of Visual Studio bundles the latest servicing release of the .NET 9 SDK, which includes some critical fixes for UWP on .NET 9, along with several tooling improvements. Here's all fixes relevant for publishing UWP applications with Native AOT:
- Fixed an issue causing UWP XAML app to occasionally hang upon suspension (https://github.com/dotnet/runtime/issues/109538)
- Fixed an issue causing occasional hangs in UWP XAML apps (https://github.com/dotnet/runtime/issues/110747)
- Fixed an issue causing occasional hangs in apps using COM/WinRT interop in some scenarios (https://github.com/dotnet/runtime/issues/110823)
📣 See feature ticket to share your feedback and continue the conversation.
New Windows SDK for UWP 📣
Visual Studio includes the latest 26100 Windows SDK, with built-in UWP support for .NET 9.
Visual Studio 17.13 includes the latest servicing release of the 26100 Windows SDK, which includes built-in support for UWP projects targeting .NET 9. This new Windows SDK features the updated version of the UWP XAML compiler, which is necessary for building UWP XAML apps using .NET 9 and Native AOT.
Along with support for .NET 9, it also includes some new improvements:
- XAML can now reference C# types using
requiredandinit-only members- XAML now also understands constructors using
[SetsRequiredMembers]- We made several codegen improvements in the XAML type info metadata table that is generated for UWP XAML libraries and applications on .NET 9, which reduces the amount of generated code (improving binary size), and also fixes some trim warnings produced by the .NET 9 analyzers.
- Disabled generation of XAML log files (.xr.xml files) for UWP .NET 9 apps. These files are only needed by .NET Native, and are not necessary when using Native AOT. This also keeps the produced packages a bit cleaner
📣 See feature ticket to share your feedback and continue the conversation.
Improved MSBuild support for UWP .NET 9 📣
Visual Studio includes improvements for the MSBuild items support for UWP .NET 9 projects.
We made several improvements to the SDK support for UWP .NET 9 apps in Visual Studio. One issue that the original tooling included in VS 17.12 is that all XAML items (eg. pages, custom controls) were being imported after project files were evaluated. This caused those items to not be available in MSBuild yet in the .csproj file, meaning they could also not be conditionally removed if needed.
We have now reworked how the UWP SDK handles including XAML items, thanks to some new support we included in the .NET 9 SDK. This allows all XAML items to be included at the same time as all other common items (eg. C# files), well before the .csproj is evaluated. This means that you can now do things such as:
<ItemGroup>
  <Page Remove="MyDevPage.xaml" Condition="'$(IsDevBuild)' == 'true'" />
  <Compile Remove="MyDevPage.xaml.cs" Condition="'$(IsDevBuild)' == 'true'" />
</ItemGroup>
And items will be correctly removed as you would expect.
📣 See feature ticket to share your feedback and continue the conversation.
Web
Extract HTML to Razor component 📣
Use a code action to easily extract HTML to a Razor component in Visual Studio.
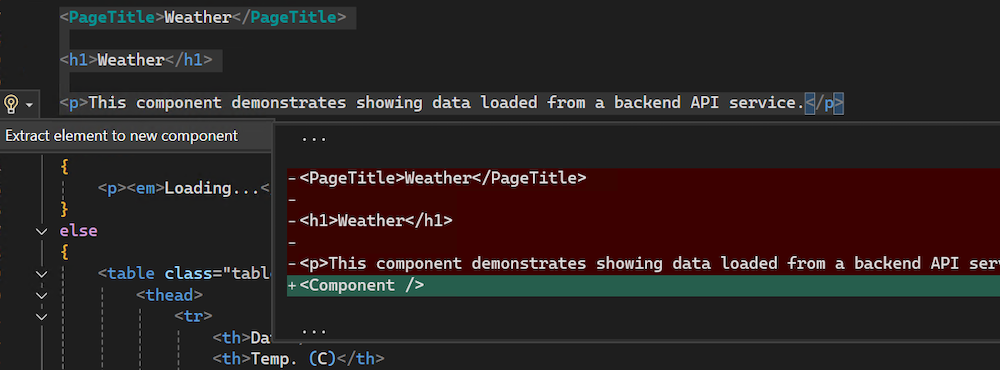
Have you ever found yourself adding too much code to a .razor file and wanted an easy way to move it to its own reusable component? When working with HTML in a Razor file, you can now use CTRL+. or right-click and select Quick Actions and Refactorings to automatically extract your selected HTML markup to a new Razor component in Visual Studio.
In this first iteration, the Extract element to new component feature is only supported with HTML markup selections.
This enhancement streamlines your workflow by allowing you to modularize your Razor components effortlessly.
📣 See feature ticket to share your feedback and continue the conversation.
Disable format on paste for Razor files 📣
You can now disable the format on paste feature for Razor in Visual Studio.
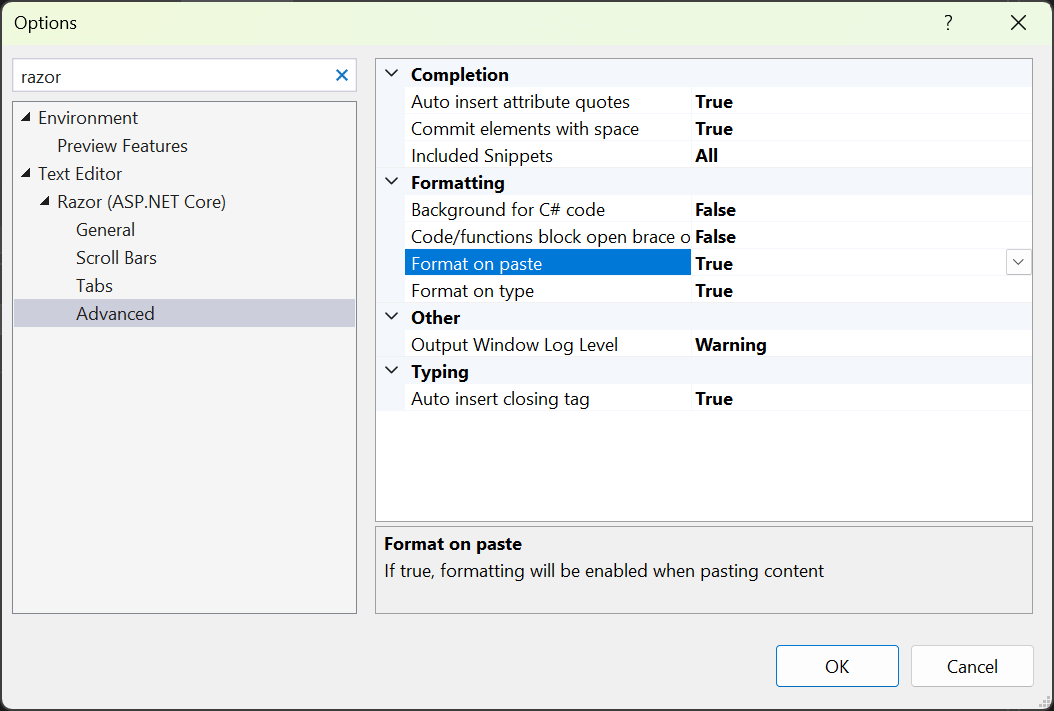
Do you find the Format on paste feature in Razor files to be more of a hindrance than a help? You can now disable automatic formatting when pasting code in Razor files.
Disable the setting by navigating to Tools → Options → Text Editor → Razor (ASP.NET Core) → Advanced and set Format on paste to False.
📣 See feature ticket to share your feedback and continue the conversation.
Gaming
Unreal Engine integration updates
Various enhancements to Visual Studio Unreal Engine integration.
We are excited to announce a series of updates for Unreal Engine integration in Visual Studio!
- We have added two new options in Tools → Options that allow you to specify Code Analysis with Unreal Header Tool for both header and source files. To enhance performance, analysis of source files is disabled by default.
- You can now specify Public and Private folders when using the Add Class wizard, ensuring that your classes are created in the correct folder structure.
Data
Use SDK-style SQL projects in SSDT 📣
You can now use the SDK-style project file format in your SQL Server Data Tools projects with enhanced SQL debugging and schema comparison capabilities.
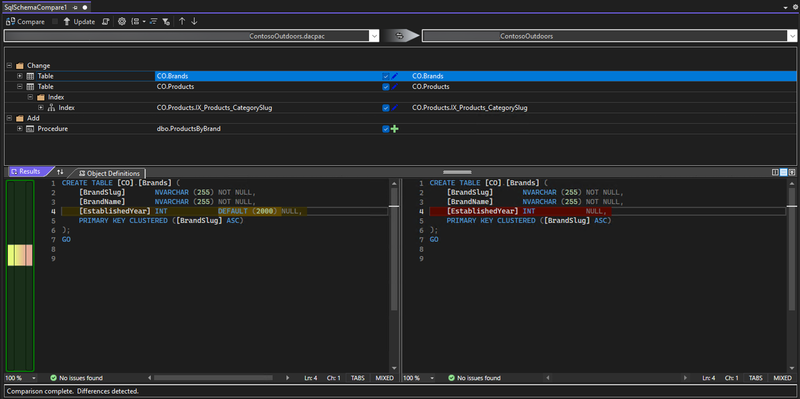
The update in Visual Studio 17.13 introduces schema comparison, data comparison, project references, and SQL debugging to SDK-style SQL Server Data Tools (preview). SDK-style SSDT SQL projects are based on the Microsoft.Build.Sql SDK, which brings cross-platform support and improved CI/CD capabilities to SQL Server Data Tools (SSDT) projects.
In 17.13 Preview 3, schema comparison is limited to database and .dacpac comparisons; SQL project comparison is not yet available. Database references are now available as project references in preview 3, support for database references as dacpac references and package references will come in a future release. A recent release of the slngen solution file generator also added support for Microsoft.Build.Sql projects, enabling managing large solutions programatically.
Additionally, the table designer and other script options have been improved in the SQL Server Object Explorer. Learn more about using the SQL debugger to investigate complex T-SQL code in development environments from the documentation.
With less verbose project files and database references to NuGet packages, teams can more efficiently collaborate on large databases in a single project or compile multiple sets of objects from several projects. Database deployments from a Microsoft.Build.Sql project can be automated in Windows and Linux environments where the Microsoft.SqlPackage dotnet tool publishes the build artifact (.dacpac) from the SQL project. Learn more about SDK-style SQL projects and DevOps for SQL.
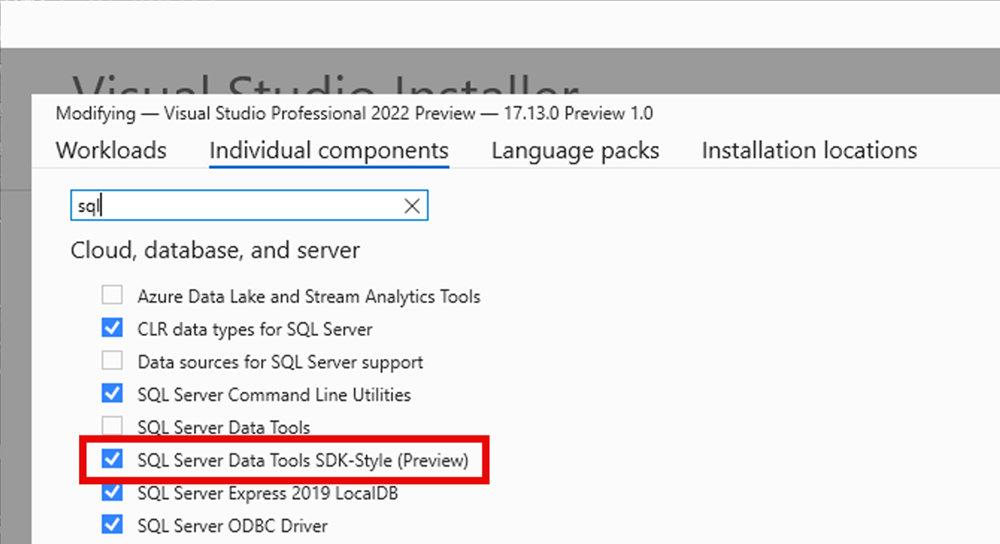
Make sure to install the latest SSDT preview component in the Visual Studio installer to use the SDK-style SQL projects in your solution.
📣 See feature ticket to share your feedback and continue the conversation.
.NET
View NuGet package READMEs
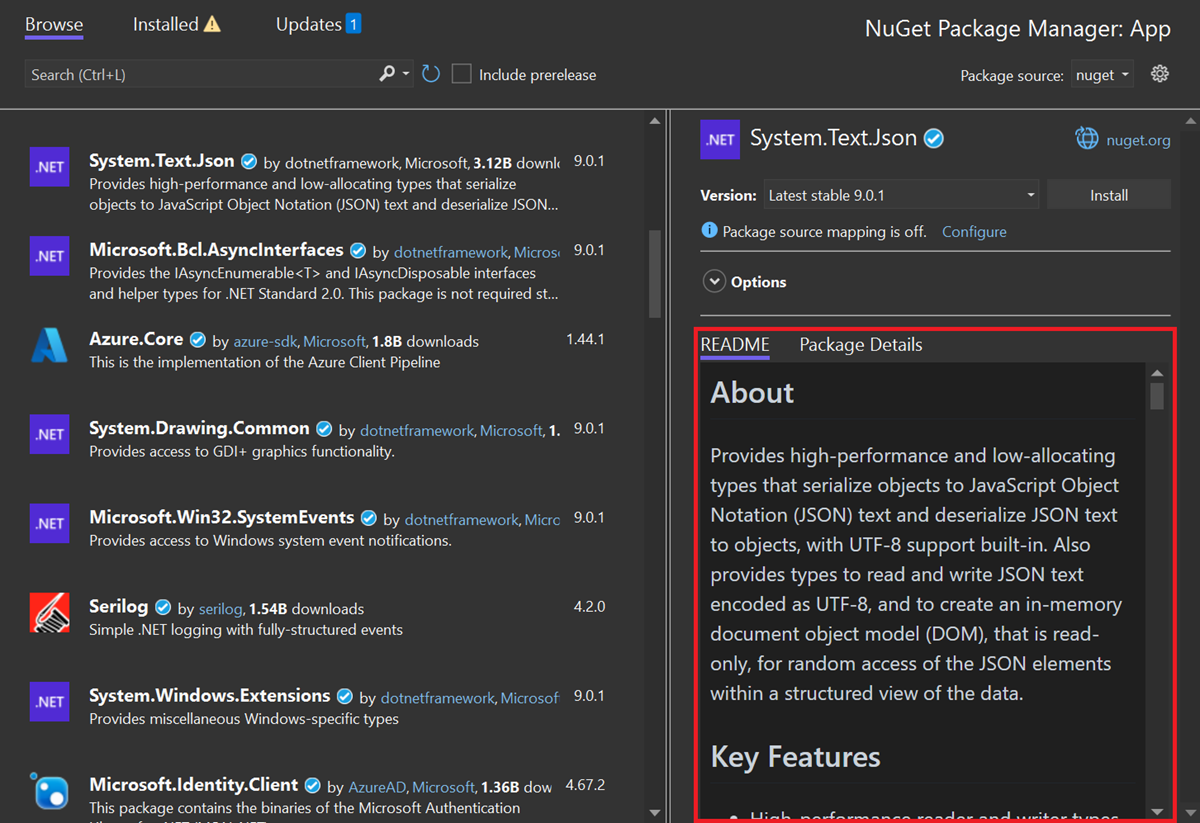
Now you can view the README for NuGet packages directly within the Package Manager.
You can now easily view README files for NuGet packages directly within the Package Manager!
This enhancement improves the accessibility of documentation, making it easier for developers to understand and utilize the packages they install.
You can find the README file in the NuGet Package Manager in the lower right corner when a NuGet package is selected.
Follow these steps to open it:
- In Visual Studio, navigate to your project or solution.
- Go to the Package Manager by selecting Tools → NuGet Package Manager → Manage NuGet Packages.
- Search for the desired package in the Browse tab or select an installed package from the Installed tab.
- If the package author has embedded a README file, you will see a README section in the package details pane. Click on it to view the README content.
Note: The README file will only be visible if the package author has embedded it within the NuGet package. This means that not all packages will have a README available in the Package Manager.
Package authors can include a README by adding a README.md file to their project and specifying its path in the project file or .nuspec file.
For more information, see this blog post.
C++
C++23 Preview Project Setting
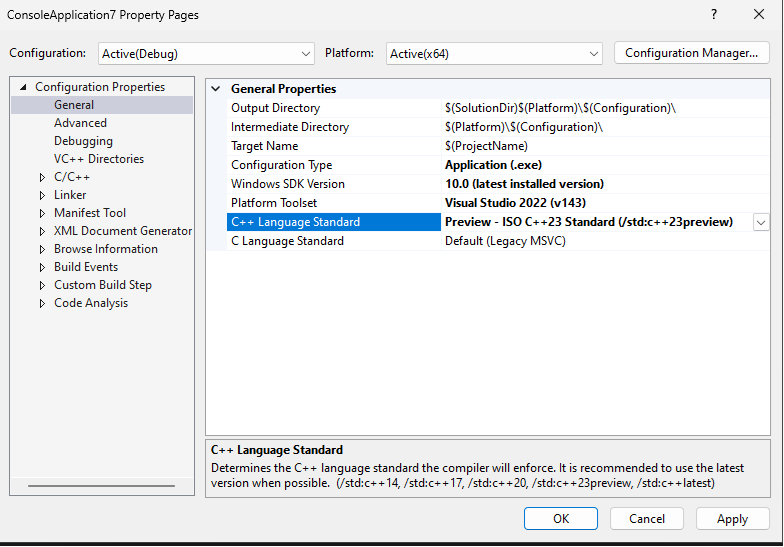
Enable a preview of C++23 from your project settings.
You can now enable a preview of our C++23 implementation in Visual C++ directly from your project settings! This new setting unlocks access to the latest features we've implemented of the C++23 standard. As this is a preview of C++23 features, those new features will have limited support and may change in future releases, but it's the perfect way to explore and get started with the C++23 language standard.
For more details and instructions, check out our documentation.
New backend property page settings
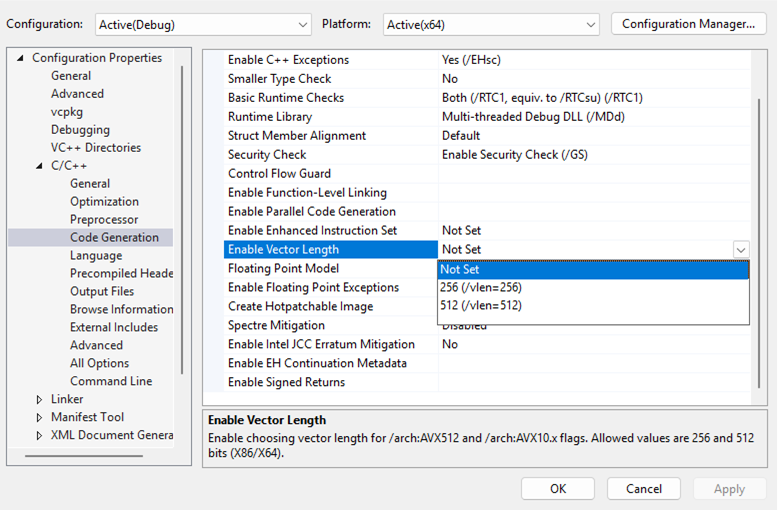
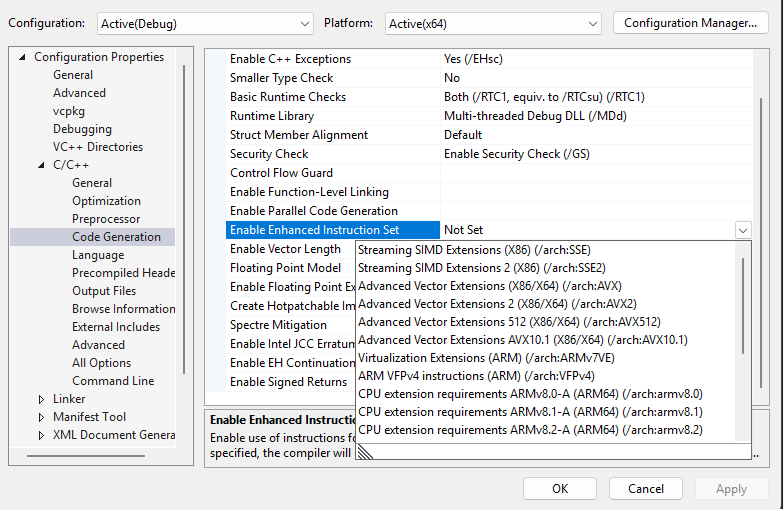
Access more x86 and x64 code generation options from the project settings menu.
Vector Length Property: Configure vector lengths for code generation on x86 and x64 directly in your C++ project settings by going to Configuration Properties → C/C++ → Code Generation.
AVX10.1Support: Unlock the power ofAVX10.1with a new entry in Enable Enhanced Instruction Set, adding the/arch:AVX10.1flag to your builds.
Check out the documentation for details and get started today!
Support for CMake Presets v9
Visual Studio now supports CMake presets verison 9.
We are excited to announce that Visual Studio now supports CMake Presets v9.
This latest version of CMake presets introduces several documented versions of macro expansions in the
includefield of a preset, making your development process even more efficient. Read more at the official CMake documentation.
Better AI code completions for C++
GitHub Copilot brings in additional context from relevant files to improve completions for C++.
GitHub Copilot code completions provide autocomplete suggestions inline as you code. To enhance the experience of C++ developers, we've updated GitHub Copilot to include other relevant files as context. This improvement helps reduce hallucinations while offering more relevant and accurate suggestions and is aligned with the current GitHub Copilot experience for C++ in VS Code.
Specify Linux timeout settings for C++
You can now specify timeout periods for your Linux machines in C++ projects via the command line in Visual Studio.
We have added support for being able to specify a minimum timeout period for your remote machines that you are connected to via the Connection Manager in Visual Studio. To learn more about adding a remote connection in Visual Studio, please see our C++ Linux documentation.
You can specify the timeout period in the Command Prompt in Visual Studio, using the new property
MinTimeoutSeconds. For example, to set the timeout period to 1 minute, you can use the following command:ConnectionManager modify <connection-id> --property MinTimeoutSeconds=60.
Top user-reported bug fixes
- Cannot add Apple Account (VS 2022, Enterprise account)
- /scanDependencies does not take into account macros exported by header units
- Screen Flickering in Git Compare
- Cannot select row via keyboard in new resource explorer
- Github Copilot with .razor pages duplicating characters
- Unable to Sign in with account that is both an MSA (Personal) and WSA (Work or school account)
- Adding resource for C++ application crashes Visual Studio
📣 See the full list of all the user-reported bug fixes that made it into this release.
Important
A breaking change has been made to Domain-Specific Language model serialization. Developers using the default serialization mechanism for their models that contain custom property types will need to add TypeConverters for those custom property types. For an example of how to do this, see Customizing File Storage and XML Serialization.
From all of us on the team, thank you for choosing Visual Studio. If you have any questions, please reach us on Twitter or Developer Community.
Happy coding!
The Visual Studio team
Note
This update may include new Microsoft or third-party software that is licensed separately, as set out in the 3rd Party Notices or in its accompanying license.
