Introducing PerformancePoint Services 2013
Greetings, everyone. It has certainly been a big few weeks for us here on the Office team. The Office Next blog was released, and it's overflowing with great information. Plus, information about the integration throughout Office BI, and how people experience data, is spectacular. Each day that I read customer feedback about the team's accomplishments for the 2013 release preview, the more I learn about how many things our customers love about it. But I also learn about the things that we still need to do (and I'm working diligently on those). In this post, I want to talk about our improvements to PerformancePoint Services in 2013.
First, however, this is a good opportunity to address the speculation, confusion, and misinformation around our PerformancePoint investments the past few years. To clarify this confusion, let me confirm that PerformancePoint will continue to be Microsoft’s solution for creating interactive, context-driven dashboards with balanced scorecards, key performance indicators, analytic reports, and filters. It will continue to be an integral part of Microsoft’s Business Intelligence offering, which I encourage you to review by downloading and trying the SharePoint Server 2013 Preview and SQL Server 2012 SP1, CTP3.
Over the coming months, we will detail the new PerformancePoint features and talk about how they work. But for now, here is an overview of what you can expect to see. You'll notice from this list that PerformancePoint continues to be a pillar in the OfficeBI stack.
1. Themes
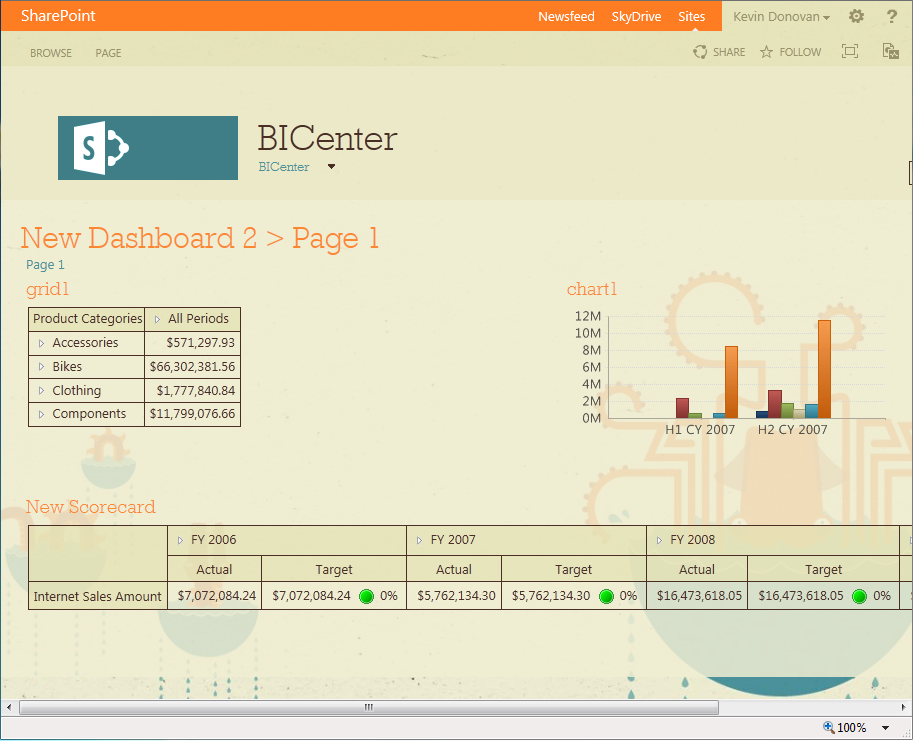
PerformancePoint now respects SharePoint's new theming capabilities. This was a lot of work for the team, and it took up the majority of our time. SharePoint cut the number of CSS files on the server by the order of hundreds, and we had to make sure that dashboards continued to look great. You can see that the background images from the theme actually bleed through the elements on your dashboard!
2. Filter Enhancements
We made a number of enhancements to PerformancePoint filters too. Here are some of the things we made better. You can now
- show sub selections in tree filters by bolding each parent in the hierarchy.
- dynamically size the tree filter height based on the number of visible items in the tree.
- select different tree filter actions by
- selecting all
- clearing all
- resetting to default
- selecting children
- getting all filter items (when 5,000 limit is reached)
- create a filter based off a measure
- see significant performance improvements
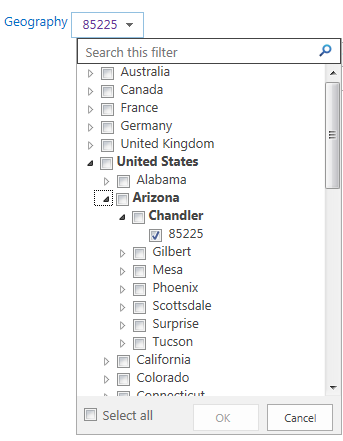
3. Filter Search
Related to all of the general filter enhancements that we made, we also implemented the ability to search amongst filter members. This has been at, or near, the top of the customer request list for a long time, and we wanted to make sure that we implemented it for the 2013 release. With filter search, you can now
- search within single- and multi-select tree filters
- search Analysis Services/PowerPivot data sources
- search Member Selection, MDX Query, and Named Set filters
We will post more in-depth discussion about filter search, but for now, I wanted to mention that this was added to the product for 2013.
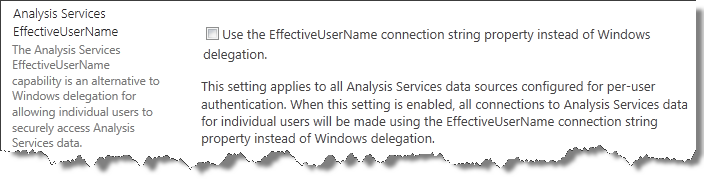
4. EffectiveUsername
This is a feature that both PerformancePoint and Excel Services implemented as a way to save the IT admin from having to set up Kerberos constrained delegation in order to use per-user authentication (applause!). When you check this option on the PerformancePoint service application settings page, you tell PerformancePoint to add the EffectiveUsername property to the connection string that it passes to analysis services (AS). The value of that property is the username of the individual user making the call. When AS sees the value, it returns the results of the query, security-trimmed to that user. The following screen shot shows the context of the feature on PerformancePoint's service application settings page.
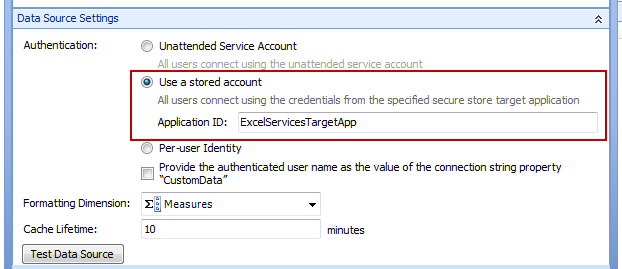
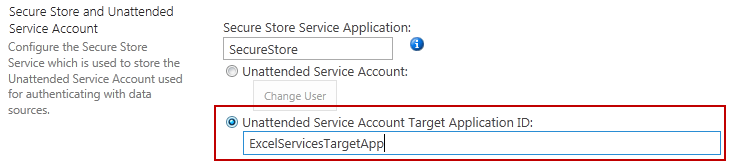
5. Custom Target Applications from Secure Store
Along the same lines as the EffectiveUsername feature, we also added the ability for you to specify any secure store target application when defining your data source in dashboard designer. If you want to, you can use the one auto-generated when you provision the service, but you don't have to anymore. This was big for customers who created target applications for Excel Services, but could not use those same target apps for PerformancePoint. Now you can provide users with a number of different target applications, each with different credential sets that map correctly to the authorization allowed by the back-end data source.
Oh, and did I mention that you can specify this option for the entire service as well?
6. BI Center
We changed up the BI Center site to make it easier to use and to highlight some of the dashboard components that have become so important with information workers. Those include PowerPivot and Excel Services. We really tried to reduce the complexity of the ppssample.aspx (BI Center from 2010) page in order to make it straightforward and simple.
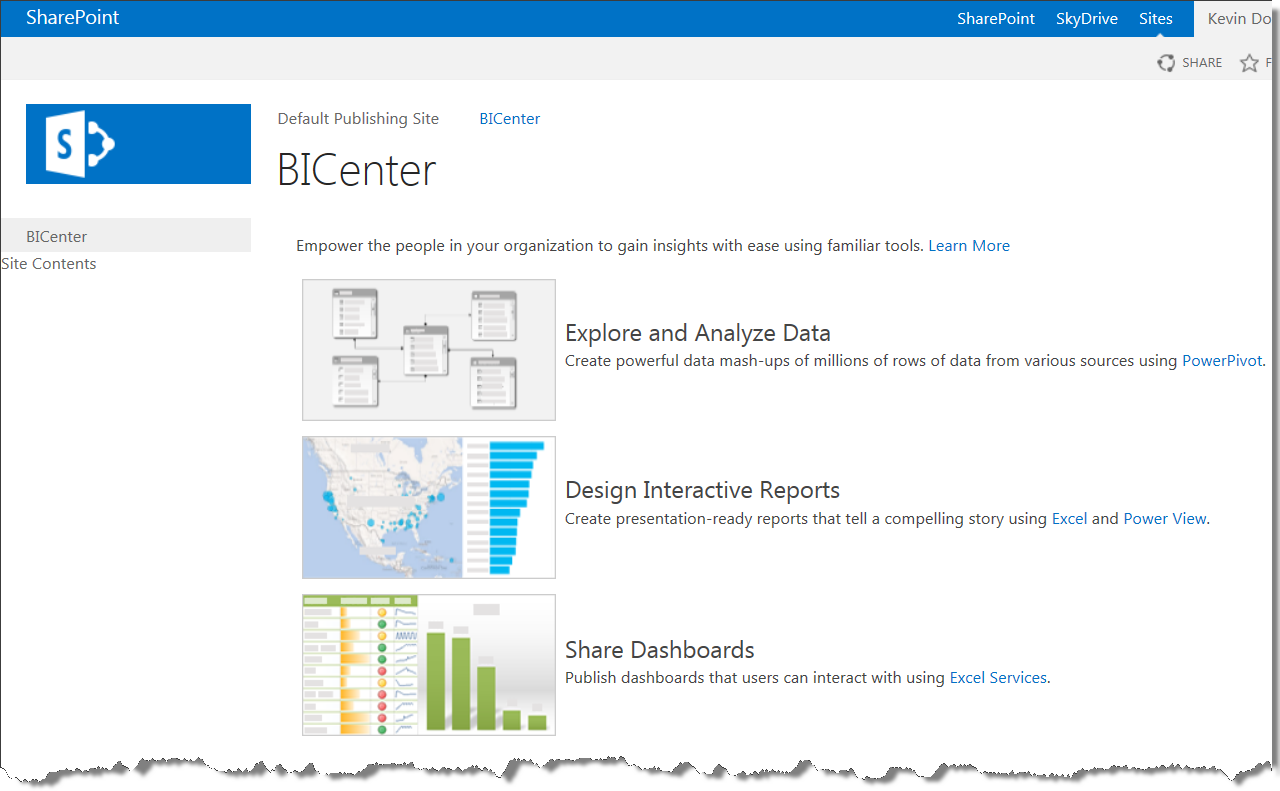
In case you were wondering, you can still get to the familiar ppssample.aspx page that you may be used to from the 2010 product (Site Contents --> Pages), but that page is no longer the primary way in which users launch dashboard designer (which brings me to the next feature).
7. Dashboard Designer in the Ribbon
PerformancePoint is now more deeply integrated into SharePoint than ever been before.
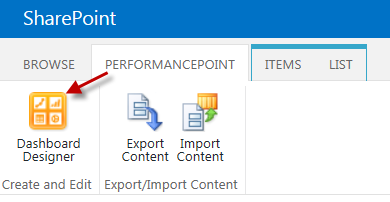
Clicking on the Dashboard Designer button launches the click-once application (yes, dashboard designer is still a click-once application). The appearance of the PerformancePoint ribbon tab is based on content type. So it appears in document libraries where the "Web Part Page" content type is present, and it appears in lists where any of the PerformancePoint content types have been added. This whole feature is great because now you can launch the designer without having to navigate to the old, BI Center landing page.
8. Server-Side Migration
This is probably the biggest feature in the list. And it really warrants its own discussion because this is a fairly complex feature. Look for a post on it in the coming weeks. But we have created a server-side dashboard migration feature that allows you to move any or all of your PerformancePoint content from one site or server to another site or server. Since PerformancePoint is primarily an enterprise dashboard service, this addresses the common complaint that there was no good way for enterprise customers to satisfy their dev --> test --> prod migration scenarios. All that has now changed. From the SharePoint ribbon, granted you have the right permissions, you can package up your content (data sources too) and migrate it to any other place in the farm.
So there you have it. We have done a lot of work in this release, and I understand that we still have a lot to do in order to address many of the the issues that customers currently face.
Again, download the SharePoint preview, and dig in. I'm excited to hear your feedback.
Kevin Donovan
Program Manager, OfficeBI
Comments
Anonymous
August 09, 2012
"This is a feature that both PerformancePoint and Excel Services implemented as a way to save the IT admin from having to set up Kerberos constrained delegation in order to use per-user authentication (applause!)" Applause indeed :DAnonymous
August 09, 2012
Sounds cool. Just... what about minor improvements like change lines and columns colours in charts, will includes bar charts, etc.. what about these design features that our customers always ask for? Despite could be a minor effort, could yields big benefits. In other hand, I've tested the preview and look fine... the major changes that I seen was the in the authentication, where we can use other SSS credentials than configured as default in service application Keep pushing forward, good work!Anonymous
August 11, 2012
It is great ... But, we are looking code stuff to customize the BI as we want.in many place, we couldn't achieve what our client is looking . is it any code stuff added ? good work !!Anonymous
August 27, 2012
Good to know these features mainly the EffectiveUserName. Does it work with SSAS 2008 R2 or only SSAS 2012 with multi-dimension or vertipaq engine? Despite of these features, PerformancePoint team should add more users friendly and developer features such as:
- Open MS Excel 2010 and see various chart types are available (i.e. Column 2D/3D/Pyramid, Pie chart with labelling outside, various Bar charts, Radar chart and Bubble chart). One of client BI PPS dashboard, we need Radar chart.
- PPS Charts should allow more features like minimum/maximum Axis scale, multiple secondary axis, cross at zero feature in chart for secondary axis, chart border color, etc...). I think PPS must be competitive product as MS Excel self-service features are stunning (the new Excel 2013 version self-service BI is more stunning!).
- PPS should have include features like Conditional Formatting (data bar, color scales, Sparkline, etc...) and convert old looking PPS filters into new Slicers (i.e. MS Excel Slicer).
- When business users analyse data in In MS Excel PivotTable there is an option 'Show fields related to' on top of the field list. This option allows end-users to select a SSAS measure group and then dimensions list will be populated that is relevant to that selected measure group. This way end-users doesn't have to remember relevant relationship between fact group and dimension in SSAS (FYI-I know Cube perspective can limit this but we have perspective with dimensions that are no applicable to few SSAS measure group)
- Bing map (including full support of entire world GIS data, not just USA!)
- When user open PPS Web-part and do in-depth data-analysis such as drill-up/down/decomposition tree. However there no link or button available for them to go back to home-page. User has to make few clicks on back button to go back to the home page. PPS team should include site navigation when PPS report web-part open. I think PerformancePoint team should look at ALL features that are currently available in MS Excel & SQL Server Reporting Services (SSRS) and should include into PPS if Microsoft want to make this product more BI competitive. Please make this available as new service-pack for SharePoint 2010!
Anonymous
January 13, 2013
Does anybody know if PPS 2013 can connect to extra data sources? Oracle as an example?Anonymous
January 14, 2013
The best way to include Oracle data sources is to use PowerPivot to connect to them, and then connect PPS to the PowerPivot model.Anonymous
February 19, 2013
Hi All, I am new to PPS. I am using sharepoint 2013 and trying to configure PPS. I had created a Business Intelligence Center site. I can see the dashboard designer and when I click on it, it is not installing. Am i missing anything? Can you please shed some light? Thanks in advance.Anonymous
March 27, 2013
I'm looking for any of the basic fixes.
- Ability to rename a column on an Analytic Grid
- Auto Column Width adjustment on Analytic Grid
- Passing values from one Analytic Chart to another as can be done with the Scorecards
- Use of parameters without losing the hierarchy navigation on Analytic Charts
- Data labels on Analytic Charts
- 2 axis graph for Analytic Charts with metrics other than percentage based All of these except #3 have had my credibility called into question in front of clients. #3 though would unlock a world of possibilities in the age of touchscreens and mobile
- Anonymous
April 18, 2013
Thanks for your post. This was very informative. As a novice user, I have certain queries.
- I have configured PPS, while creating a analytical data source using the standard connection, the cubes are not popping up even if given the right server IP.
- How do I change the series color
Anonymous
May 12, 2013
@Arun If you are using SQL 2012 as your source and running SharePoint 2013 and the cubes do not show the possible reason is that ADOMD 10 is not installed. With SQL 2012 Version 11 gets installed but you need the 64 bit version of the SQL 2008 release which is SQLSERVER2008.ADOMD10.msi . After installing do an IIS resetAnonymous
November 13, 2013
technet.microsoft.com/.../ee748644.aspx office.microsoft.com/.../about-user-permissions-for-performancepoint-services-HA010369183.aspx Setting up permissions for a Designer.. at https://RootSite/Sites/SiteCollection/Subsite/Subsite/Subsite-Dashboard. I had to not only grant Designer and Owner permission at SubSite-Dashboard, but also at the SiteCollection level. Is this correct? Shouldn't I be able to grant Designer permission at just the lower level and have him function correctly?Anonymous
November 20, 2013
If your permission inheritance ends at the sub-site level, then that is where you need to grant Designer permissions. If they roll all the way to the top, you will need to grant them at the top. Never should you need to grant Owner permissions for DD to save or publish.Anonymous
March 11, 2014
Hi Kevin, I've been looking for more information related to the Server-Side migration feature, and have yet to find anything substantive. You mentioned that you'd create a blog post about it, but I don't' see anything. Do you have any more information available about it, as this sounds like it will be a great help for use moving between dev, test, and production farms.Anonymous
March 11, 2014
Hi, Evan. Sorry for not getting to the blog. I had the best of intentions! For the server-side migration feature, there is a UI piece and a PowerShell piece. About which one were you looking for more information?Anonymous
March 13, 2014
Both. All my searches for information about it just bring up articles discussing it as one of the new features, rather than how to actually use it.Anonymous
May 02, 2014
Is there a way to import PerformancePoint 2007 KPIs and Scorecards to SharePoint 2013? Is it possible first of all?Anonymous
May 02, 2014
Unfortunately, there is no migration path from 2007 to 2013. You have to go through 2010 on the way to 2013.Anonymous
May 27, 2014
Hello Kevin, It has been nearly two years from the release of the Performance Point 2013 and there is no place where it's explained the way to do the server-side migration. Is there any plan to publish some kind of information regarding this topic? Thank you.Anonymous
June 09, 2014
Hello Kevin, I am also looking for how to do the server-side migration. Is there any post/article coming on this subject soon? Thanks.Anonymous
October 16, 2014
Hello Kevin, What are the new features in PPS 2013 Which is Not In PPS2010?Anonymous
December 20, 2014
Kevin, can you do a blog update on PPS 2013? What are lessons learned so far? What's the road map for 2014? What are the top 10 new features you'll be working on?Anonymous
January 28, 2015
Hi Kevin Do you have any update on point #3 mentioned by '20Side' on "Passing values from one analytic chart to another". Even I am looking for a solution for this scenario. Any help on this would be really appreciated. Thanks.Anonymous
January 30, 2015
@PPS Developer, can you paint me a more specific picture of what you're trying to do? For example, are you trying to use the value from one series as a filter on another chart? @Edgar, that's a good suggestion. I'll pass that along and have someone get working on it :-)Anonymous
February 05, 2015
Hi Kevin Yes, I am trying to use the value from one series as a filter to another chart. Here is the example, I have a pie chart that provides sales data by year, and when I click on the pie chart, the values (value corresponding to that region of pie) should pass on to another chart which should show products sold for that year. Thanks in advance.Anonymous
March 22, 2015
HI is annonymous access supports in sharepoint 2013 bi site? when i try to open analytic chart report without login it asking authentication, where as in sharepoint 2010 not, we have to show some bi dashboards to public users in our portalAnonymous
September 12, 2015
I am tring to configure a memeber selection filter to a score card in PPS, it always gives me an error message, any help ?? Error: Unable to get filter values. An unexpected error occurred. Error 54909. Additional details have been logged for your administrator.Anonymous
September 14, 2015
Ashok, without knowing what's been written to the event log, it's impossible to say what's happening. I would start there.Anonymous
November 13, 2015
Can you recommend a good book on PerformancePoint 2013 ? After creating a chart in the SharePoint Designer (series: InvoiceMonth - bottom axis: Amount - background: InvoiceYear) I end up with the following sequence for the Month series: April, August, December, February ...
- obviously, following the alphabetical order on the month names instead on the month number.