Application Analytics and Browsing Forks
[Do you tweet? Follow me on Twitter @matthawley ]
We deployed the latest version of the CodePlex software today.
Application Analytics
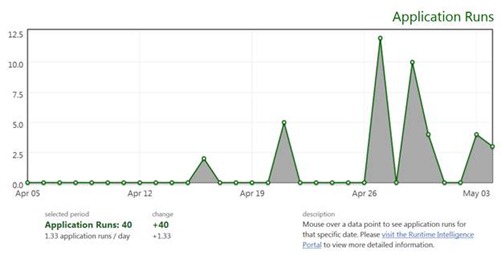
 With today’s release, CodePlex users now have the ability to instrument their applications to get analytics on their runtime usage. CodePlex has long offered reports on what user activity occurs on the project website, but what happened after the user downloaded the software was unknown. Now, using this new application analytics capability, CodePlex users can see information such as how many people are using the application.
This capability is provided by the new Runtime Intelligence Service from PreEmptive Solutions. The Runtime Intelligence Service allows for developers to inject usage instrumentation directly into application binaries. When the application is run by an end user, the instrumentation will collect analytics data from the application. No personally identifiable information is ever collected and applications can include opt-out dialogues.
CodePlex users instrument their .NET applications via the latest release of Dotfuscator Software Services Community Edition included in Visual Studio 2010. Application analytic reports will then be available on CodePlex from the project statistics page with the ability to view more advanced statistics through a portal hosted by PreEmptive Solutions.
Getting started with instrumenting your application is easy. PreEmptive Solutions has created a sample application and a very thorough walkthrough that demonstrates this process. Once you have instrumented your application, you will need to link your CodePlex project to your Runtime Intelligence Service Application ID (which was created in the first step in the walkthrough). As a project coordinator, edit the project details and enter the value as shown below.
Should your startup / shutdown instrumentation mean something different, you can change the display name, which will be used instead of “Application Runs” when viewing the statistics in CodePlex. After you save these settings, CodePlex will begin importing the application runtime usage on a daily basis.
Browsing Forks
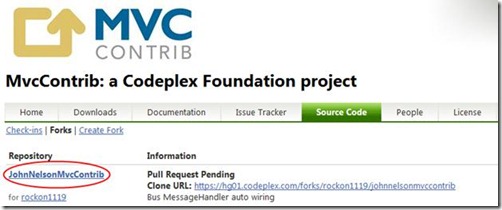
Also with today’s release, you now have the ability to browse a fork’s source code similarly to browsing a project’s source code. When you view the listing of forks, each fork name is now clickable.
Upon clicking the fork name, you’ll be taken to a familiar change set listing page. From there, you can view change set details, browse the fork’s source code, and download the individual change sets just as you would for a project.
Comments
Anonymous
May 06, 2010
The comment has been removedAnonymous
May 06, 2010
CuttingEdge - The instrumentation platform has built-in functionality to support end-user 'opt-in.' We at PreEmptive Solutions are strongly encouraging the developers of participating projects to include a clear opt-in dialog to end-users. Many commercial applications ask users if they would like to send usage data back to the company so they have the opportunity to improve the product. We are just offering this functionality to open source projects. If you or anyone else has further concerns we would very much like to hear from you. You can contact me at treynolds@preemptive.com Thanks TimAnonymous
May 07, 2010
Awesome! Thank you for adding this... Man I love CodePlex. :)Anonymous
May 07, 2010
The comment has been removedAnonymous
May 07, 2010
"First, I would like to bring some clarity to what is happening here. CodePlex is NOT introducing instrumentation into any projects nor is it even providing technology to do so. The injection of instrumentation is accomplished via a utility included with Visual Studio 2010, the Community Edition (CE) of Dotfuscator." Fist you say that but then you say this: "I think that the CodePlex team should be applauded for choosing to democratize this kind of capability and to make "open analytics" available to the 14k+" So much clarity. Oh great Microsoft Oracle tell me what's "open source"? Well my dear ignorant soul, "open source" is: Code obfuscation proprietary modules usage tracking lack of trustAnonymous
May 09, 2010
The comment has been removedAnonymous
May 13, 2010
you can use this service without any obfuscation, just manually call the service on startup: http://so-s.info/PreEmptive.Web.Services.Messaging/MessagingServiceV2.asmx

