The Case of the System Process CPU Spikes
As you’ve probably surmised by my blog posts and other writings, I like knowing exactly what my systems are doing. I want to know if a process is running away with the CPU, causing memory pressure, or hitting the disk. Besides keeping my computers running smoothly, my vigilance sometimes helps me spot performance and reliability problems in Windows and third-party code.
The main way I keep tabs on things is to configure Process Explorer to run automatically when I log in. Whenever I configure a new computer, I add a shortcut to Process Explorer to my profile’s Start directory that includes the /t (minimize) switch. Process Explorer runs otherwise hidden with tray icon that shows a small historical view of CPU activity level. Because I want access to detailed information about system processes, as well as my own, I also specify the /e option on Vista, which causes Windows to present a UAC prompt on logon that allows me to grant Process Explorer administrative rights.
Because I keep an eye out for CPU spikes in Process Explorer’s tray icon, which show up as green or red for user-mode (application) and kernel-mode (operating system and drivers) CPU usage, respectively, I’ve identified several application bugs over the last few months. In this post, I’ll share how I used both Process Explorer and another tool, Kernrate, to identify a problem with a third-party driver and followed the problem through to a fix by the vendor.
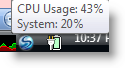
Not long after I got a new laptop several months ago, I noticed that the system sometimes felt sluggish. Process Explorer’s tray icon corroborated my perception by displaying a mini-graph of red CPU activity. The icon opens a tooltip that reports the name of the process consuming the most CPU when you move the mouse over it, and in this case the tooltip showed the System process as being responsible:
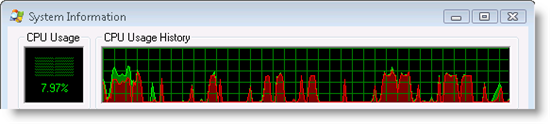
The first few times I noticed the problem, it resolved itself shortly after and I didn’t have a chance to troubleshoot. However, I could see by opening Process Explorer’s System Information dialog that the CPU spikes were significant:
The System process is special because it doesn’t host an executable image like other processes. It exists solely to host operating system threads for the memory manager, cache manager, and other subsystems, as well as device driver threads. These threads execute entirely in kernel mode, which is why System process CPU usage shows up as red in Process Explorer’s graphs.
I suspected that a third-party device driver was the cause of the problem, so the first step in my investigation was to figure out which thread was using CPU, which would hopefully point me at the guilty party. I watched vigilantly for signs of trouble every time I switched networks and jumped the first time I saw one. Process Explorer shows the threads running in a process on the Threads page of the Process Properties dialog, so I double-clicked on the System process and switched to the Threads page the next time I noticed the CPU spike:
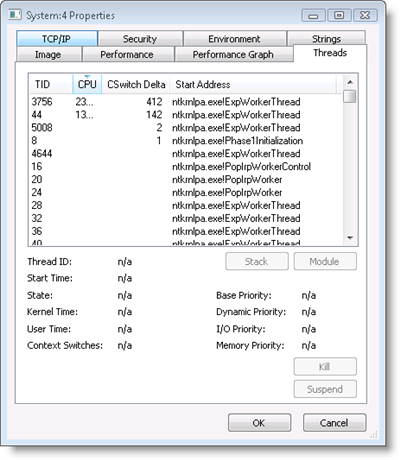
The “ntkrnlpa.exe” prefix on each thread’s start address identified the ones I saw at the top of the CPU usage sort order as operating system threads (Ntkrnlpa.exe is the version of the kernel loaded on 32-bit client systems that have no execute memory protection or server systems that need to address more than 4GB of memory). Because I had previously configured Process Explorer to retrieve symbols for operating system images from the Microsoft public symbol server, the thread list also showed the names of the thread start functions. The most active threads began in the ExpWorkerThread function, which means that they were worker threads that perform work on behalf of the system and device drivers. Instead of creating dedicated threads that consume memory resources, the system and drivers can throw work at the shared pool of operating system worker threads.
Unfortunately, knowing that worker threads were causing the CPU usage didn’t get me any closer to solving identifying a root cause. I really needed to know what functions the worker threads were calling, because the functions would be inside the device driver or operating system component on whose behalf the threads were running. One way to look inside a thread’s execution is to look at the thread’s stack with Process Explorer. The stack is a memory region that stores function invocations and Process Explorer will show you a thread’s stack when you select the thread press the Stack button or double-click on the thread. On Vista, however, you get this error when you try and look at the stack for threads in the System process:
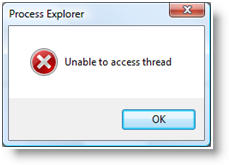
The System process is a special type of process on Vista called a “protected process” that doesn’t allow any access to its threads or memory. Protected processes were introduced to support Digital Rights Management (DRM) so that hi-definition content providers can store content encryption keys with a reduced risk of an administrative user using DRM-stripping tools to reach into the process and read the keys.
That approach foiled, I had to find another way to see what the worker threads were doing. For that, I turned to KernRate, a command-line profiling tool that’s a free download from Microsoft. KernRate can profile user-mode processes and kernel-mode threads. It uses the sample-based profiling facility that was introduced in the first release of Windows NT, which records the unique addresses at which the CPU is executing when the profiling interval timer fires. When you stop a profile capture, Kernrate retrieves the information from the kernel, maps the addresses to the loaded device drivers into which the fall, and can even use the symbol engine to report the names of functions.
I wouldn’t need symbols if the trace identified a device driver, so I ran Kernrate without passing it any arguments. Despite the fact that there’s no officially supported version of Kernrate for Vista, the version for Windows XP, Kernrate_i386_XP.exe, works on Vista 32-bit (you can also use the recently-released xperf tool to perform similar profiling - xperf requires Vista or Server 2008, but works on 64-bit versions). I let the profile run through heavy bursts of CPU and then hit Ctrl+C to print the results to the console window:
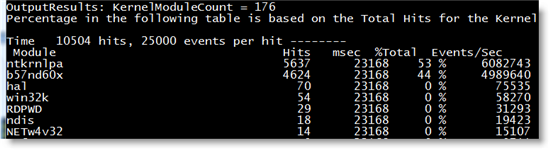
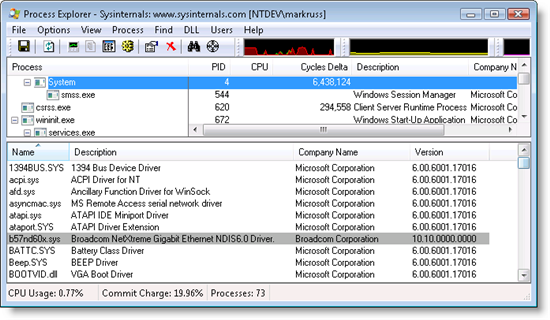
In first place were hits in the kernel, but in second was a driver that I didn’t recognize, b57nd60x. Most driver files are located in the %systemroot%\system32\drivers directory, so I could have opened that folder and viewed the file’s properties in Explorer, but I had Process Explorer open so a quicker way to check the driver’s vendor and version was to open the DLL view for the System process. The DLL view shows the DLLs and files mapped into the address space of user-mode processes, but for the System process it shows the kernel modules, including drivers, loaded on the system. The DLL view revealed that the driver was for my laptop’s NIC, was from Broadcom, and was version 10.10:
Now that I knew that the Broadcom driver was causing the CPU usage, the next step was to see if there was a newer version available. I went to Dell’s download page for my system, but didn’t find anything. Suspecting that what I noticed might not be a known issue, I decided to notify Broadcom. I used contacts on the hardware ecosystem team here at Microsoft to find the Broadcom driver representative and email him a detailed description of the symptoms and my investigation. He forwarded my email to the driver developer, who acknowledged that they didn’t know the cause and within a few days sent me a debug version of the driver with symbols so that I could capture a Kernrate profile that would tell them what functions in the driver were active during the spikes. The problem reoccurred a few days later and I sent back the kernrate output with function information.
The developer explained that my trace revealed that the driver didn’t efficiently interact with the PCIe bus when processing specific queries and the problem seemed to be exacerbated by my particular hardware configuration. He gave me new driver for me to try and after a few weeks of monitoring my laptop closely for issues, I confirmed that the problem appeared to be resolved. The updated driver has not yet been posted to Dell’s support site, but I expect it to show up there in the near future. Another case closed, this time with Process Explorer, Kernrate, and a helpful Broadcom driver developer.
If you like these troubleshooting blog posts, you’ll enjoy the webcast of my “Case of the Unexplained…” session from TechEd/ITforum. Its 75 minutes are packed with real-world troubleshooting examples, including the one written up in this post and others, as well as some that I haven’t documented. At the end of the session I ask the audience to send me screenshots, log files and descriptions of their own troubleshooting success stories, in return for which I’ll send back a signed copy of Windows Internals. The offer stands, so remember to document your investigation and you can get a free book. I’ve gotten a number of great examples and my next blog post will be a guest post by someone that watched the webcast and used Process Monitor to solve a problem with their web server.
Finally, if you want to see me speak live, come to TechEd US/IT Pro in June in Orlando where I’ll be delivering “The Case of the Unexplained…”, “Windows Server 2008 Kernel Advances”, and “Windows Security Boundaries”. Hope to see you there!
Comments
Anonymous
April 07, 2008
Love this kind of investigation, thanks Mark!Anonymous
April 07, 2008
> Because I want access to detailed information about system processes, as well as my own, I also specify the /e option on Vista, which causes Windows to present a UAC prompt on logon that allows me to grant Process Explorer administrative rights Somewhat off-topic, but what's your opinion of using Vista's Task Scheduler to launch applications at startup/login with elevated privileges? I use this technique to start Task Manager* elevated without facing a UAC prompt. *: No offence, but I start Process Explorer for the heavy stuff and leave task manager running always.Anonymous
April 07, 2008
Nice and detailed story again! I was at your demo/presentation in Barcelona and suggest people to download and watch the webcast, really cool stuff ;)Anonymous
April 07, 2008
Imagine that you tried to get this fixed through the support form on the vendor's web site. That way we would have known if tech-savvy people who don't have a "hardware ecosystem team" to turn to also could manage to get something like this resolved in such a delightful way as you did. Cheers, DavidAnonymous
April 07, 2008
Mark, Thanks for these posts on your blog. This is THE best info I have seen for troubleshooting. I love the toolset you created. They are the first tools I go for when there is a problem. They have solved countless problems for me. Cheers!Anonymous
April 07, 2008
Mark, The /mimimize switch for process explorer is actually /t, at least for current version :). Great post, BTW!Anonymous
April 07, 2008
Wow, I read this and was supprised to find the exact problems I've been having on my Dell laptop. I had narrowed down the offending problem to the System "process" and was about to dig further. I guess now I'll just wait for the new driver and see if that fixes the problem. Thanks for the article, not only did it help me fix my problem, it also was very informative in tracking down these kinds of problems.Anonymous
April 07, 2008
Excellent Article!! Thank's Mark!Anonymous
April 07, 2008
Mark, You said you always have Process Explorer running in background whenever you start Windows. Do you have any idea what kind of additional stress this puts on system? I want to do this as well but corncerned that this will eat away my CPU cycles which will eventually cause slow down of system.Anonymous
April 07, 2008
Thanks for the great article, especially the kernrate and xperf tools. I quite like ThreadMaster as a tool/workaround for flattening out CPU spikes, but it's not a match for quality debugging. Now I've just got to work out how I'm going to hook up kernrate/xperf via Powershell to my MRTG graphs...Anonymous
April 07, 2008
>...The System process is a special type of process on Vista called a “protected process”... Mark, restrictions of running inside protected processes requires that these processes be specially signed. Ooops...What about malware running as a protected process!! But does the process need to be signed, or is it the binary image on disk that needs to be signed? /Nader the restrictions of running inside a protected process, the operating system requires that these processes be specially signedAnonymous
April 07, 2008
Thanks! Now I know what's causing my problems and was able to repro with the same results as you. Feel like sharing that driver? :)Anonymous
April 07, 2008
Thanks, Mark--great article!! Your passion to troubleshoot these issues--and then share in clear, concise detail how you did it--is a fantastic benefit to the community. I have to echo an earlier comment about your support "backdoor," though--most of us are used to stonewalling and levels of isolation when trying to resolve these types of issues with a vendor (sometimes it feels like communicating with Prince--you have to pass notes to the official correspondent, hope it passes their own filter, pray it's communicated correctly, then perhaps get a response). Then, it seems like it takes a miracle to make it onto the Dell support site--I'm personally waiting on a driver update for an easily reproducible issue with Intel's integrated graphics driver (OptiPlex 745) for Vista. I've reported the issue and followed up several times, but still there's no update. The updated driver has been available from Intel since April 2007, and is even on Windows Update (but not in a way that can be mass-deployed as far as I've tried). In other words, these articles are brilliant... but unfortunately, even with such skills, it's often exceedingly hard to get a vendor response.Anonymous
April 07, 2008
What about KernRate for Windows Server 2003 x64 ? Perhaps you can find it on Microsoft.com I found http://www.nynaeve.net/?p=132Anonymous
April 07, 2008
Great article, but begs the question of how to get these sort of problems resolved if you don't work for Microsoft.Anonymous
April 07, 2008
Heh; I'm having a weird issue with my Dell laptop too (like Geoff), narrowed it down to System Process - and my suspicion has been that it's the dang broadcom driver, but I've been unable to dig in any deeper. (seems to be worst when I'm connected via wireless, and when I'm transferring large files, and especially, when I'm in my living room, where my wireless signal isn't the best; the CPU spikes, then the connection drops - when the system gets into this "state", I can't even shut down gracefully. Won't even ctrl-alt-del, just hangs). I'm very much looking forward to the new driver, hopefully that fixes it. I'd like to learn how to set up a Symbol server and load symbols, so I don't run into the troubleshooting "brick wall" for these kernel-mode driver cases.Anonymous
April 07, 2008
Boy are you living in a special world Mark! Those of us out here in the sunlight would still be trying to get past the Vendors first level "tech" in India.Anonymous
April 07, 2008
nice post, good to see a lot of explanation and background info for the concepts you talk about - that helps a lot when trying to understand it all.Anonymous
April 08, 2008
> The main way I keep tabs on things is to configure Process Explorer to run automatically when I log in. Whenever I configure a new computer, I add a shortcut to Process Explorer to my profile’s Start directory... This is programmer's nirvana. To use daily your own tool... Keep up the good work!Anonymous
April 08, 2008
Brilliant! This problem has been plaguing me for a couple of years. I was hoping you'd blog about it.Anonymous
April 08, 2008
Your articles are always interesting to me. I'm a linux user that supports a lot of corporate windows networks. Of course the part of the article that annoys me is that DRM is limiting you from easily troubleshooting a problem. For a non-uber-windows-developer like me, at the point it said "Unable to access thread" I would have given up. And I would imagine more than a few Microsoft customers would feel the same way.Anonymous
April 08, 2008
The comment has been removedAnonymous
April 09, 2008
I wish I didn't have to deal with these problems...I blame drivers for every problem I have, someone should really make WHQL hard to get, so things like this do not happen. Drivers need to be stricter.Anonymous
April 09, 2008
I too have had issues with Broadcom Gb ethernet drivers. We built a Dell Dual Xeon server system purely to host a SQL 2005 server (for use with MS Business Contact Manager) on Win2003. It worked fine during testing, but when deployed suffered from excessive sessions of 100% CPU usage (often for hours), during which time users suffered slow and stuttery Outlook 2007. Spent ages fiddling with SQL, no effect then one day figured out via the SQL Dashboard, that SQL was spending excessing time on network I/O (about 80% time). Updating the Broadcom network driver, as you did, and bingo CPU usage is hardly moves, except at 8.30am - 9am as users connect.Anonymous
April 09, 2008
The comment has been removedAnonymous
April 10, 2008
Very nice to see a short, real-world example using Kernrate - since using it to check where time was spent in a UMDF vs. WDM driver, I had almost fogotten about it. Yes, also my Vista laptop is sometimes sluggish (just micro-freezed a second ago again!), and thanks to this post I will use Process Explorer and Kernrate to check out why. And as I'm already writing: Thank you (both) for the excellent, "slim" and extremely useful Windows system tools you give us admins and developers (for free!) for all these years. Back in 1997, when working in admin + 2nd level support, tools like filemon and regmon were often essential for finding the root cause of a problem. They were certainly much quicker than the available alternative - debugging and/or trying to profile a foreign application. One thing has not changed in all these years: the "Sysinternals" tools - today e.g. Process Explorer and Process Monitor - are extremely useful. These days I use them for driver and application maintenance: e.g. with WinObj I could finally verify that our "mutants" were active and properly named. This blog - and the webcast you link to above - make it much easier to grasp their potential by giving real-world examples. To sum up: Thanks! (A lot!) (...and sorry for the long post)Anonymous
April 13, 2008
The comment has been removedAnonymous
April 14, 2008
Nice investigation! As always :)Anonymous
April 15, 2008
I have the same issue, hopefully the drivers will be posted soon.Anonymous
April 15, 2008
RaFi, Kernrate is part of the Windows Server 2003 Resource Kit Tools and works very well on x64 platforms.Anonymous
April 17, 2008
Helpful article - thanks! I wonder if the tools can help in the same way to show the reason for the mysterious 90-100% CPU Windows Explorer hits that come and go for long periods in Vista. Can these be due to 3rd party code in worker threads too?Anonymous
April 17, 2008
Mark, thanks for this, just the advice on getting Process Explorer running on boot was invaluable; a 450mHz Pentium III is at full stretch with XP. For the person who asked earlier about the processor usage of ProEx, it is 1%-2% on my rather elderly machine.Anonymous
April 17, 2008
Great article! But...who is running Vista?Anonymous
April 17, 2008
Awesome article! Unfortunately, we are all stretched so thin in IT that we rarely have the time to become such experts in this area. Mark, makes it sound so easy ( That is why he has a Ph.d ), however any Systems administrator knows how difficult such a problem is to isolate, and even more so, it it is intermittent. Jose Medeiros San Jose, CAAnonymous
April 17, 2008
The comment has been removedAnonymous
April 21, 2008
I run Process Explorer as a service when the machine boots by using Microsoft's SrvAny. It not only ensures that Process Explorer is running every time the machine boots it also allows me to logon as a normal User and have Process Explorer running as NT AUTHORITYSYSTEM. I also have an AT command set to run it at 7am everyday so if it has exited the previous day its there running again each morning again.Anonymous
April 23, 2008
Mark, can you ask Broadcom if the changes to the driver had anything to do with TCP/Offload or TOE? I work for a large hosting company and we have had issues with Broadcom drivers on both DELL and HP servers. specifically: [HKLM]SYSTEMCurrentControlSetServicesTcpipParameters EnableTCPChimney EnableRSS EnableTCPAAnonymous
April 29, 2008
If HKEY_USERS...SysinternalsHandleEulaAccepted = 0 in the Registry, then handle.exe /accepteula does not work correctly.Anonymous
April 30, 2008
@Jose: And how hard it is to get support from the NIC vendor (since support is usually through a computer manufacturer whose support, honestly, isn't geared toward troubleshooting NIC driver problems. it would be nice if we could all look up a dev in a hardware manufacturer database and send them and email...Anonymous
May 02, 2008
Hey Mark, Thanks for the interesting post. I had the same problem and following your article I was able to detect that my b57nd60a.sys driver is causing the same problem. I have a HP laptop, but apparently it has the same network card by Broadcom. I have version 10.10 of the driver and I am now waiting for HP to release a new driver. Since I have a 64bit Vista, I used xperf. This is what I have done:
- Installed Windows Performance Tools Kit from the link you provided
- ran: C:Program FilesMicrosoft Windows Performance Toolkit>xperf -start -on diag
- ran: C:Program FilesMicrosoft Windows Performance Toolkit>xperf -stop -d c:tempresult.etl
- Opened the ETL file in the viewer.
- Clicked "Summary Table" on a CPU graph.
- Expanded until I found the problematic item. Very interesting indeed. Regards, Arik.
Anonymous
May 07, 2008
It was a great read! I can just say that maybe, to avoid this kind of investigations, one might just use Linux...Anonymous
May 10, 2008
Mark, I am sending out a prayer. All I ask is that Windows 7's top priority is speed. It should be faster than XP. Vista was never even an option for me after I discovered lower benchmarks across the board. Within my circle of friends, not a single one even considers Vista an option due to its performance problems. Don't release Windows7 until you've got a codebase that is faster than XP, period.Anonymous
May 12, 2008
Hi Mark! Great post as usual.. Im a frequent user of the tools that you have written. Process Explorer and Process Monitor have helped me troubleshoot quite some problems.. I have started documenting some of my ordeals too. You have asked us to share our success stories with you, but you haven't mentioned how? Psst.. whats your email address?Anonymous
May 19, 2008
I found the article very helpful, so thanks Mark. Looking beyond desktop machines, can this be implmeneted to troubleshoot servers as well? Working in an organisation that serves internet web applications, is there any way to run these tools remotely rather than from the environment itself? Look forward to you next article.Anonymous
May 19, 2008
Great article! We happen to be analyzing resource spikes (cpu,ram,hd)in client PC's with layered security built from several best-of-breed security products, so this is very helpful to us. Hopefully we'll be able to tweak layered security performance to eliminate unnecessary resource hogs but still maintain comprehensive security protection.Anonymous
May 22, 2008
The comment has been removedAnonymous
May 23, 2008
hello. great post! in fact it describes same exact trouble that I have. could you please send me that renewed driver that you got from dell. because they still don't have it on website. saint_ff@Mail.ruAnonymous
May 25, 2008
The comment has been removedAnonymous
May 27, 2008
I have had the same issue. So far I have been hesitant to install the driver update from Broadcom. But after calling Dell and being told they will not support Vista (as my D820 came with XP orignally) I decided to bite it installed the updated driver from the Broadcom site. The spikes have dissapeared. http://www.broadcom.com/support/ethernet_nic/netxtreme_desktop.phpAnonymous
June 04, 2008
This happens because the hardware vendor will configure every possible driver for the entire machine to be loaded and enabled even for devices you do not use. As a plea for help, can we get a Windows version with a user friendly way to disable drivers and services for parts that are not needed? Some examples: Zero configuration wireless networking service Windows image acqusition (WIA) service SSDP discovery service FAX service etc. Our standard desktop is severely slowed down by the extra RAM usage used by the unneeded processes and drivers. Lastly, can some of the always loaded processes (e.g., print spooler) be put into a hibernate mode where they use minimal memory until a print request comes in from the user? Spooler is using 9mb of RAM on a machine booted 1 hour ago where there has been no print jobs started.Anonymous
June 04, 2008
Yep, I had issues with Brodcomm and the Chimeny stack as well. Once I turned off the chimeny stack all was well, but didn't get a new driver to fix it however since then MS has posted a hotfix to turn the tcp chimeny stack off by default instead of on by default which is much better. So if you were able to get a debug version of the driver and Kernrate to get the functions that a protected process used, then couldn't the same method be used to be able to snoop and get past the DRM and get teh keys anyway? DRM doesn't work, there is always away around it so just get rid of it.Anonymous
June 08, 2008
I have the same exact issue described in this article with my Inspiron 1525. Occasionally the Broadcom driver takes up 50% of both cores of my Core2Duo 2.0Ghz and will not fix itself until the system is restarted. Sending/recieving in Microsoft Outlook 2007 reproduces this error every time for me. Is there a way I can fix this? I'm at my wits end. Mark makes reference to a 'fixed driver' he recieved but I cannot find it anywhere. MUCH THANKS FOR ANY HELP!Anonymous
June 13, 2008
Updated drivers are available on Broadcom site at http://www.broadcom.com/support/ethernet_nic/netxtreme_desktop.php Hope this helps :-)Anonymous
June 19, 2008
I installed the newest Vista driver (10.82.0.0a) on my Dell Precison M70 from Broadcom's site menitoned above. Since then all peaks on the system process disappeared. Thanks!!!Anonymous
June 23, 2008
The comment has been removedAnonymous
July 11, 2008
I've noticed that the system process has been using 17% of my cpu for some time now. I finally got around to kernrating it, and lo-and-behold it was the same Broadcom driver. Installing the new version has made the system process nice and quite again. Thanks Mark! P.S. I couldn't get xperf to admit that the Broadcom driver was at fault, perhaps I didn't specify the correct logging option.Anonymous
July 17, 2008
Had the same problem you described (100% CPU spikes) with my Vista installation on HP Compaq nx8220. Tracked it down as directed and replaced the driver with the one from the Broadcom-Site. http://www.broadcom.com/support/ethernet_nic/driver-sla.php?driver=570x-Vista32 Everything's back to normal now - thank you so much.Anonymous
July 30, 2008
Wow, amazing how quickly problems get solved when people share each other's secrets a la open source. Microsoft acts internally more like open source, and expects the public not to. Or perhaps everybody gets PDBs just for the asking.Anonymous
August 02, 2008
This is a very good presentation : Well Explained, i wanted to know if we would be able to find out drivers / Process under the System Process, On our terminal Servers we see System Process having an Handle on NTUSER.dat file under the profile directory. How to detect which is the culpritAnonymous
September 26, 2008
Mark, How about adding something like a "Monitor drivers" feature to Process explorer where it uses the same sequence of debugging steps to maintain a list of non-microsoft device drivers that frequently use a lot of cpu? I know some would always be expected to show up but perhaps these can be marked as known and then unknown ones highlighted? This idea needs refining but might be worth adding, Cheers, AkazAnonymous
November 02, 2008
Hi Mark, I have Process Explorer instead of Taskmanager. One problem I used to face is ProcExp will open with standard user privilage so incase I need to see inside system processes it will fail. Today I noticed that I can add a /e switch in registry itself where ProcExp places a shortcut as debugger. So each time I press Ctrl+Shift+Esc to open ProcExp I get UAC prompt and I can open it in Admin mode. Good learning, thanks to Autoruns which gave me the path in registry.Anonymous
November 19, 2008
Thanks for troubleshooting and in the replies the link to the Broadcom vanilla driver. From Wireshark, I noticed this seemed to be happening when Outlook 2007 was trying to talk RPC/DCE to the Exchange server. There was a repetitive 4 packet transaction, not sure what either Outlook or the server trying to do or why this affected the BroadCom card.Anonymous
November 21, 2008
FYI, the latest version of KernRate that runs on Vista and Windows 2008 is available in Windows 2008 DDK (it's in toolsother). There're both 32-bit and 64-bit versions. The DDK itself is a free download from Microsoft.Anonymous
December 02, 2008
The comment has been removedAnonymous
February 17, 2009
Thanks to this article I was able to trace the constant CPU usage of about 40% on my system to ACPI.SYS. It appears to be looping after coming out of sleep mode and the only way to stop it is through a Restart. Unfortunately I am stuck now. Vista says the driver is up to date and it won't allow it to be removed or disabled. I've seen a few other posts elsewhere with the same problem but none with a fix.Anonymous
March 08, 2009
Nice article. Having used Kernrate, a mention of krview would have been nice. I have seen the reports generated by krview is very informative and a nice document to send it across for further analysis. I wonder why Microsoft is not coming up with a x64 version kernrate. Though this is OT, I am using this thread to bring to your attention and hope you can use your contacts inside to do something about this. I have not tried xperf yet as I use XP...Anonymous
March 24, 2009
I've found a problematic thread using process explorer, but can't suspend it...get the same error message-"unable to access thread" I tried using kernrate but after I press control-c the window just disappears. Is this because it only shows the results by printing? Or is it because I'm using Vista-64 and need to try xperf? Also, isn't there anyway to disable the security protecting of the file I want to access? Via Dos prompt or what? Any help you guys can give would be helpful, but anyhow, kudos on an excellent post!Anonymous
June 12, 2009
Great article. I had CPU spiking up on the system process and went through your diagnostic process. It turned out to be the same Broadcom driver that was causing the issue. I downloaded the latest driver and the issue is resolved now. Many Thanks.Anonymous
August 09, 2009
Again a great article. I would really like to watch your webcasts but unfortunately the bandwidth in Thailand is too poor. Is there any way to download the video files? Thanks SukonAnonymous
April 11, 2010
That's a great help for me, thank you! I've followed your article step by step to identify the problem but got results I can not explain. I have two Ethernet NIC in my machine, and one of them is always off. Recently I was to use it too and noticed it slows down the system (around 5% of CPU time spent in system process). While Process Explorer shows CPU usage in main window, it doesn't report any CPU activity when threads tab is opened for the system process. On the other hand, KernRate reported that intelppm is where vast hits are done (76%). intelppm is a processor driver, and I see no reason for it to be affected by NIC driver. I tried latest available drivers for my NIC but it didn't solve the problem. Is there any other way to track down to the NIC driver - just to make sure it is exact place where problem occurs? Best regards, Anton.Anonymous
April 20, 2010
The comment has been removedAnonymous
April 23, 2010
Hi Mark, My PC had a similar problem like your laptop from time to time. The process “System” was using most of the CPU and I did not know why. That was annoying. I searched the Internet for information to possible causes in the past but found no solution. Today the problem occurred again on my PC and I searched the Internet again. Other than before today I found your article in my search results and directly thought that this article could be helpful because I already read articles from yours in the past that impressed me. Then I read it and to my happiness it really helped me to find the cause of the problem on my PC. I also used Process Explorer based on your article for the search. In my case in the threads page of the properties to the process System was shown that ssrtln.sys was using all of the CPU. Based on this information I then searched the Internet to ssrtln.sys and found further information on the following site: http://kb.roxio.com/search.aspx?URL=/content/000001DL According to the content of this site ssrtln.sys is an essential part of the DLA boot process created by Sonic. Because I do not use DLA I did not need it. Therefore I followed the steps to deactivate it and after the reboot the problem was not there again. I hope it will stay like this. Otherwise thanks to you and your great tool Process Explorer now I know how I can find out which individual elements are running inside the process System so that I can check again which are using all of the CPU. That is really great. Thank you very much for this article, for your tools and your help in general. Bye, John D. BlueAnonymous
November 15, 2010
Mark, You are the man! My Dell laptop has this exact same problem! Thank you for taking the time to report it. I'm going to check the Dell support site to see if there's an updated Broadcom driver. I ran KernRate and I got the similar results. Using process explorer I can see that I have the same 10.10.0.0 b57nd60x driver as you had in 2008. Thank you! I wish more people were are picky about performance as you are! Results for Kernel Mode:
OutputResults: KernelModuleCount = 175 Percentage in the following table is based on the Total Hits for the Kernel Time 6762 hits, 25000 events per hit -------- Module Hits msec %Total Events/Sec ntkrnlpa 4968 11159 73 % 11130029 b57nd60x 976 11160 14 % 2186379 win32k 284 11160 4 % 636200 hal 199 11159 2 % 445828 nvlddmkm 178 11160 2 % 398745 intelppm 68 11160 1 % 152329 dxgkrnl 20 11160 0 % 44802 Ntfs 15 11160 0 % 33602 fanio 11 11160 0 % 24641
- Anonymous
December 26, 2013
Very nice post!! Thank you for the apps hint! - Anonymous
December 31, 2013
I've been working my way backwards through your wonderful 'cases of'. But I find that now I'm looking at the earlier cases the embedded images are no longer to be seen! Without them it's difficult to hang on to the argument.Is there some way to get them back? - Anonymous
December 31, 2013
I'm looking into the image problem.