Exploring EventSource Activity (correlation and causation) Features
In this post we will be going over the New EventSource Activity support introduced in .NET version 4.6. If you use EventSource in a server (concurrent) environment, you will want to read this post.
What are Activities?
If you have been using EventSource in sever scenarios you probably have wanted what I am calling 'Activity' support.
The basic issue is that events are great at telling you about what happens at A SINGLE INSTANT IN TIME, but almost always you care about the WHOLE FLOW of your application. Now if your application is only doing one thing at a time, then the chronological ordering of events does a pretty good job of grouping related events together. Thus in a single threaded app, if you have incoming HTTP request 'Start', a series of outgoing HTTP requests, and then the HTTP response, then the inference that the outgoing request are related to the incoming request is a pretty good assumption. However if you have CONCURRENT or OVERLAPPING activities, than this logic VERY QUICKLY breaks down and interpreting your events becomes impossible (in this case, more information is not better).
If you application was singly threaded, is I just that you have multiple threads running simultaneously, then the problem is pretty easy to fix. You need only stamp each event with the ThreadID logging the event. With this extra information you can simply sort the events into separate streams each of which a unique thread ID and we are back to the singly threaded case an life is good again.
Sadly live in a real server is not that simple. The problem with ThreadIDs is
- Threads typically do work on behalf of other threads. Typically threads 'listen' for incoming requests in some way, and then process them. Thus any application that makes use of several of these services cannot easily be grouped together. If several concurrent threads are all requesting work from these worker threads, again you get a tangle of event that is impossible to untangle.
- Asynchronous programming (which is all to common now), makes this problem MUCH worse, because the concept of a Thread becomes tenuous. Basically every time you do an I/O the next operation will happen on whatever thread is most convenient to use. In such a world using threads as a correlation ID is hopeless.
So what we need is to come up with another concept that is very much like a thread of execution, but works in a concurrent / asynchronous world. This is what an activity is. More formally
An activity is a set of causally related events, linked by an common ID.
Thus an activity:
- Starts at a particular point in time
- Causes 0 or more other events to fire.
- Stops at a particular point in time (and thus has a duration which is the difference in time between the start and stop).
One more important aspect of an Activity is that the can NEST (that is one activity can cause another activity before the first completes. Thus they can form stacks just like methods do. In fact most typically there is a close correspondence between an activity and a particular CALL FRAME of a method in the code.
EventSource Activities in .NET V4.6
In .NET V4.6 we have made it very easy to use activities. But first, you have to have .NET Version 4.6
- If you are on Windows 10, you have .NET V4.6
- If not, do a 'start c:\Windows\Microsoft.NET\Framework\v4.0.30319', right click on the 'clr.dll' and look at the 'properties' of that dll. Select the 'Details' tab and see the 'File Version'. If it says V4.6.* you are good to go.
- In not you can update your system by going to the .Net V4.6 download page, downloading and installing it. This release is very compatible with previous versions so this is a 'safe' thing to do.
- After probably about 4/2016, windows update should do this for you automatically.
- If you have installed VS 2015 you also have .NET V4.6
Once you have .this version of .NET. It is very easy to use Activities in EventSource. Simply name some of your events with a 'Start' or 'Stop' suffix. For example
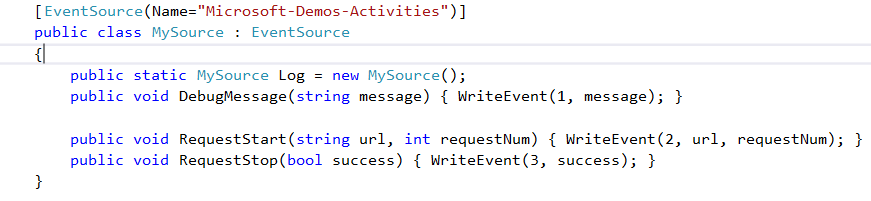
Makes an EventSource 'Microsoft-Demos-Activities' that has a Request activity. This activity has; a 'Start' and 'Stop' event associated with it. (Note to simplify finding the pairs of events, 'Stop' events need to use an event ID that is one bigger than the corresponding 'Start' event. Because the events with the 'Start' and 'Stop' EventSource knows that this represents an activity called 'Request' and does the following 'magic'
- Creates a new Activity ID to represent the new activity when the 'RequestStart' event is logged
- Attach this activity ID to EVERY EventSoruce event (even from different EventSources), that is logged from code CAUSED BY code after the Start event.
- Until the 'RequestStop' event fires, in which case the Activity reverts to what it was before the ServiceStart.
If you collect your events with PerfView (Version 1.8) there is basically no change. You can simply collect your events normally For example for my I did
PerfView /threadTime /onlyProviders=*Microsoft-Demos-Activities collect
Now to make things interesting, I ran the code that processed requests in a Parallel.For loop that processes 20 requests concurrently. After stopping PerfView and looking in the 'events' view for RequestStart and RequestStop events, this is what I see.
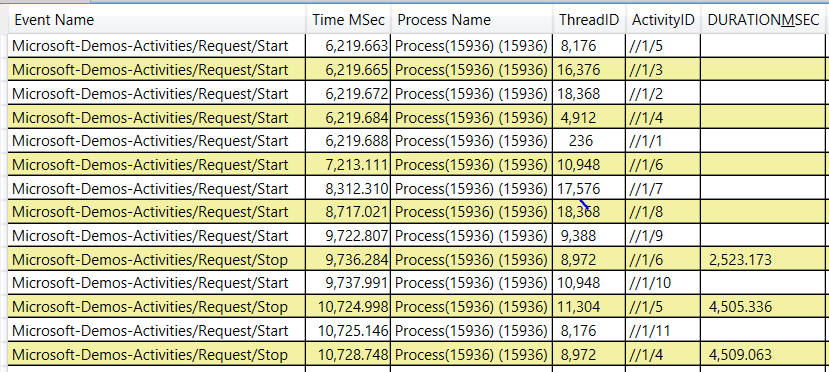
Which shows that different threads are executing different requests and each get an activity ID (for example the first is //1/5). Notice that the thread that finishes the request is not even the same thread that started it (for example Request(//1/6) starts on thread 10948 and stops on thread 8972). Because PerfView can link up the starts and stops, it can also compute the duration, which it shows as the pseudo-field DURATION_MSEC, so we can see that Request(//1/6) took 2523 milliseconds.
You will note that the 'ActivityID' has the from like //1/6, that is it looks like a path (list) of numbers. This is precisely what it is and it is designed to capture the fact that activities can nest. When an activity nests inside another activity, instead of simply picking another unique number it APPENDS a new child to the path of numbers. This creates a very useful property: All work associated with a particular activity has the same prefix.
We can see this if we look at all the events in the 'events' view. What we would see is many events interleaved with one another like this
Notice that the activity IDs 'jump around' as work on different requests gets executed in parallel. However we can easily focus one particular request simply by including only those vents with a certain ActivityID prefix.
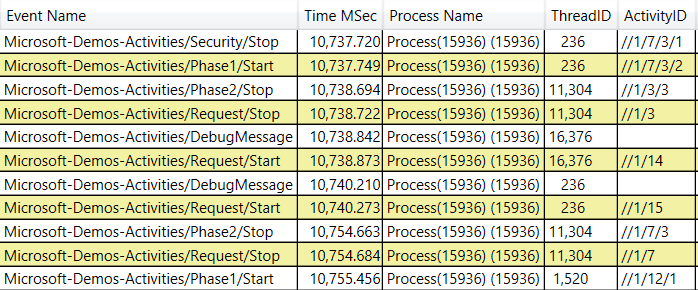
For example if we put //1/6 in PerfViews 'Text Filter' textbox, that will only show you events that have that string and you get the following display

This is a very useful view! It shows you all the events associated with a single request filtering out all other requests. Notice it includes other events that are Not Starts and Stops (e.g. DebugMessage), and while it is not shown above, it would also include other EventSources (not just Microsoft-Demos-Activities). It also shows 'sub-activities' ('like Phase1 and Phase2) and shows their nesting relationship. For example we can tell that SecurityStart at 8206.265 is nested inside of Phase 1 because its activity ID (//1/6/1/1) is a superstring of Phases 1's activity ID (//1/6/1).
Now we can see the value of making ActivityID paths of numbers rather than simply a arbitrary unique numbers. It lets you express nesting and thus easily express concepts like 'everything that I caused, transitively'.
In fact, it is very natural to display activities as a tree, where the parent of a child node is simply the node that caused it. PerfView can display this in the 'Any StartStopTree' view which shows every event organized into a tree showing the activities that caused it. For example in this trace.
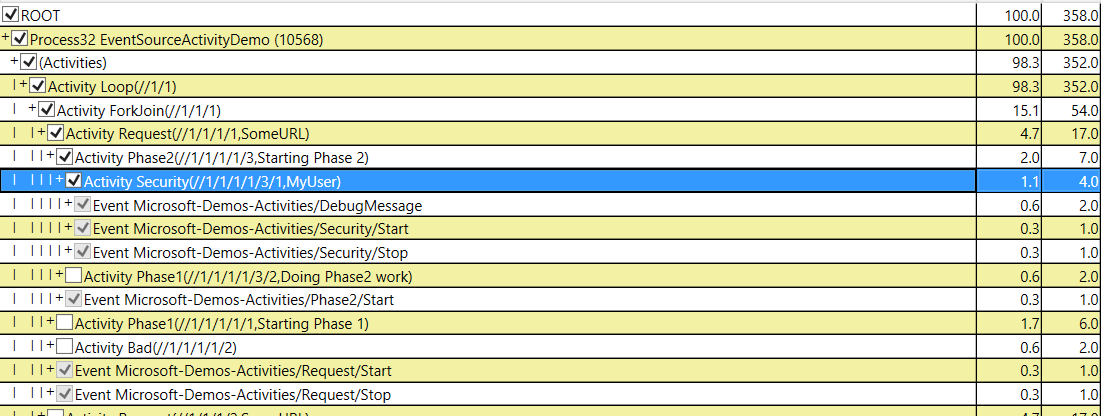
We see that the process started a 'Loop' activity //1/1, caused a ForkJoin' activity //1/1/1 , which cases a 'Request' activity //1/1/1/1, which caused a Phase2 activity //1/1/1/1/3 which caused a Security activity //1/1/1/1/3/1 which then logged a Debug message. Thus activities look a whole lot like call stacks, and in fact you can treat them like 'coarse callstacks' in many analysis.
Sorry, Activity Support no available in the Nuget package (yet).
One important caveat to the Activity tracking support is that it is presently Not Available in the EventSource Nuget package. (This is a reminder that we always recommend that users use the System.Diagnostics.Tracing.EventSource class built into the framework if you can, however we provide a 'clone' of this class in a Nuget package by renaming the class to Microsoft.Diagnositics.Tracing.EventSource, for those TEMPORARY cases where you need an EventSource feature on a older runtime. However in this case, Activity support required ehancements outside of EventSource itself to implement which is why the feature is not available in the Nuget package. We may be able to 'hack' some sort of partial support, but for now you need to upgrade to V4.6 to get activity support.
Summary
We covered quite a bit of ground today, there is more to talk about, which I will do in the next few blog posts. However for any who can't wait, I strongly suggest you read the New EventSource Activity support specification (attached at the end), which goes into a lot more detail about how it actually works, where it might produce surprising results, and how it interoperates with other Activity tracking conventions.
But the key take-away, is that activities are INDISPENSIBLE in a server environment when you are doing many things concurrently/asynchronously. EventSource has made this super-easy to do (simply name your events with the Start and Stop suffix), and PerfView makes it very easy to immediately take advantage of the value that EventSource adds to your events.
In my next blog entry, I will do more of a walk though of actual code so you can try it yourself.
Here is the document that goes into more details.
Comments
Anonymous
September 15, 2015
Almost all pages of EventSourceActivities.docx have this footer: Microsoft Confidential. © 2015 Microsoft Corporation. All rights reserved. By using or providing feedback on these materials, you agree to the attached license agreement. Is that still valid? I don't see any attached license agreement.Anonymous
September 15, 2015
You can ignore the Confidentiality comment. I will fix it.Anonymous
October 20, 2015
Is this start/stop suffix naming convention documented in MSDN?Anonymous
November 09, 2015
Hi Vance, Your word document states there is a cost to enabling Tpl activity tracking. Does this only impact events that are decorated with the start/stop and numbering convention, or all events? Also, when enabling Tpl tracking in a TraceEventSession, what is the appropriate convention? I'm doing: traceSession.EnableProvider(providerGuid: new Guid("2e5dba47-a3d2-4d16-8ee0-6671ffdcd7b5"), providerLevel: TraceEventLevel.Informational, matchAnyKeywords : (ulong)0x80);Anonymous
November 09, 2015
It is my expectation that the overhead when turning on TPL tracking will be confined to start and stop event. As far as turning it on. TraceEvent has a TplEtwProviderTraceEventParser which represents the TPL EventSource. There are fields for both the provider GUID and keywords. I would use those symbolic names in my EnableProvider statement.Anonymous
December 16, 2015
The comment has been removedAnonymous
December 17, 2015
The code as shipped in V4.6 of the runtime did not interact with 'classic' ETW activity IDs (which is what you are doing when you use SetCurrentTreadActivityID) properly. This has been fixed in the next release of the framework (V4.6.2 due out in in the second quarter of next year). You can work-around it in the mean time by using the Nuget version of EventSource on a V4.6 version of the runtime. One difference if you do this is that you do not use the Task library EventSource to turn on tracing but the EventSource provider 'Microsoft-Tasks-Nuget' (Keyword remains the same = 0x80) to turn on the tracking. This should work.- Anonymous
June 28, 2016
How do you enable this provider when running from PerfView ? I tried doing thisPerfView.exe /OnlyProviders=*MyActivityEventProgram,*Microsoft-Tasks-Nuget run but again I see relatedActivityIds are empty
- Anonymous
Anonymous
December 22, 2015
The comment has been removedAnonymous
December 22, 2015
I don't have detailed knowledge, but my expectations is that hotfix releases only include those fixes that were very blocking where a couple months is a problem. This does not fit this category.Anonymous
January 07, 2016
Hi Vance, What would be the cause of the TraceEvent.ActivityID being Guid.Empty? The TraceEvent I'm receiving in my listener is showing the event name marked up as {EventName}/Start, so I know it's partially working...Anonymous
January 07, 2016
@ajhuddymsdn Guid.Empty is the default value for an activity ID that was not otherwise set. Thus there are many possible scenarios where it may reasonably be empty. However presumably you believe that this should have a value. We need more information to do a proper diagnosis (why do you believe it should have a value), and are there any interesting things going on (async or other non-trivial operations between the start and the event that does not have an ActivityID). Finally knowing versions of your CLR and whether you are using a Nuget package are all interesting for the diagnosis.Anonymous
March 30, 2016
The comment has been removedAnonymous
April 25, 2016
The comment has been removedAnonymous
May 17, 2016
Hi Vance,First of all, thank you very much for the great job done by you and your team on the ETW tools, i have only recently learned about them and have found them very useful. I have a question about implementing Activity correlation and tracking outside of trace sessions. The scenario is this:I have an ASP.NET MVC application that is currently firing events from an EventSource class, and in addition to performance tuning (trace sessions), we have created an EventListener that will save some of the events into the DB, and everything is working fine. However, we recently got a requirement to save the events into the DB in a different thread to improve performance, and while i can see that PerfView is able to capture and link activity ids when using events with the Start and Stop suffix, when the event reaches the listener that saves it to the DB, the Activity ids are Guid.Empty. We are currently using the HostingEnvironment.QueueBackgroundWorkItem method to queue log operations in the background, and it is my understanding that it uses tasks, yet Activity Ids are not preserved.Is there any workaround you can think of to accomplish this or shall we do some sort of activity tracking via activity scopes, global objects or something else?Regards!