Using TraceEvent to mine information in OS registered ETW providers
In previous blocks on TraceEvent I shows you how easy it was to start up ETW sessions to collect information generated by System.Diagnnostics.Tracing.EventSource classes (typically logging that you yourself did). But I also mentioned in other blogs that the one of the real strengths of ETW was the fact that you get to correlate lots of OS generated events with your own. Well in this entry I will show you how to do this (although I will show you even better ways in later blogs).
In this blog I will walk though a simple application called 'ProcessMonitor' which basically prints a line to the screen every time a process on the system starts or stops. There is a ZIP file of a VS2010/VS2012 solution at the end of the blog and I encourage you to open it and read the code and play around with it. I have removed comments and error handling a the 'essential' code is only about 35 lines of code. Here it is.
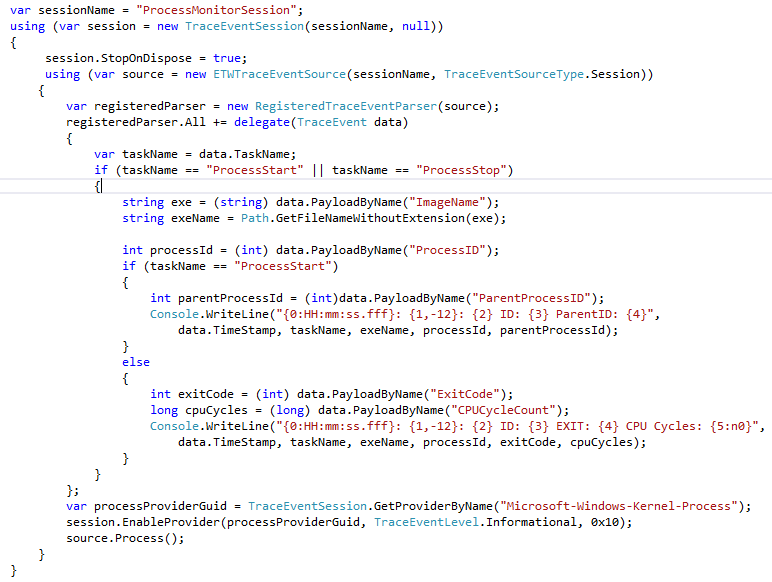
The basic structure is basically the same as the 'real time' (no file) EventSource example that I already blogged about. Basically you
- Open a TraceEventSession (with a null file name to indicate a 'real time session'. A session is a 'controller' which can turn ETW providers on and off.
- Connect a ETWTraceEventSource to that session, A TraceEventSource represents the stream of events that were sent to the session. An ETWTraceEventSource knows the 'basic' structure that is common to all events (like that every event has a process id, time stamp, source provider, task and opcode, but does NOT know how the name of the event or how to deserialize the payload of the event.
- Connect one or more TraceEventParsers to the ETWTraceEventSource. A TraceEventParser knows how the event names and how to deserialized the payload bytes of the raw ETWTraceEventSource FOR A PARITULAR SET OF EVENT PROVIDERS. In this case we connect the 'RegisteredTraceEventParser, which knows how to decode any event that was registered with the operating system (using wevtutil). EventSource are NOT typically registered (although they can be), for EventSources you connect a DynamicTraceEventParser (because EventSources log their event information at EventSource startup time (dynamically). However in this case we are interested in the OS providers, and so RegsiteredTraceEventSource is what we want. It is common to register both.
- Subscribe to the event callbacks of TraceEventParsers that you connected to your source. Some parsers are 'strongly typed' in that they know the exact name and fields of every event they know about at compile time (ClrTraceEventParser and KernelTraceEventParser are like this). These are the best to use because they are VERY efficient (no string lookups), you get to use normal C# property accesses (since the names of these properties are known at compile time), and are type-safe (no casting needed). However both DynamicTraceEventParser and 'RegisteredTraceEventParser can not work like this because they fetch the information about events at runtime (not compile time), and thus look more like a reflection API. In a later blog post I will show you how to fix this by generating TraceEventParsers for use at compile time, but until that we will make do with the limitations of 'RegisteredTraceEventParser . Because 'RegisteredTraceEventParser' does not know at compile time the names of ANY events, you can't subscribe to particular events with this TraceEventParser, instead you can only subscribe to 'All' meaning all events this parser knows how to parse. Once inside the callback you can then filter out the particular events of interest. In our case most of the code above is the delegate body that gets called on every event that 'RegisteredTraceEventParser knows how to parse.
- Enable the ETW Providers for the events you are interested in. In the example above we use the GetProviderByName() API to convert the name Microsoft-Windows-Kernel-Process to is unique ID, and then used that to enable the provider with and level (verbosity) of 'Informational' and a 'keyword' (bitset) argument '0x10' . The 'keyword ' argument is a bitset that indicates which events to enable. It is not uncommon to use -1 (all 1s bitset, or every event in the provider), however in this case we 'knew' the right bitset was 0x10 (more on how we did that below).
- Process incoming events by calling the ETWTraceEventSource's 'Process()' method. For files, this returns when all the events in the file are processed. For real-time sessions, it only ends when the 'ETWTraceEventSoruce.StopProcessing()' method is called.
Once Process() is called, as events come in your event handlers will be called (for real time sessions there typically is a 1-3 second delay between the event happening and being called back in your Parser). In our case we are looked for events with at 'TaskName' of 'ProcessStart' and 'ProcessStop' and based on what we see there we call 'PayloadByName' to fetch particular payloads (and cast them to the correct type), and then process them (in this case simply print a message to the Console.
So you can see, that the actual mechanics of making this tool is reasonably straightforward, however we make two important observations:
- The callback code is not very friendly. It has lots of 'magic names' which if incorrect, will simply cause nulls to be returned (which means casting will throw an exception). You had to know what type various things were (was CPUCycleCount an int, uint, long, ulong?) and you can imagine that the code behind 'PayloadByName' is relatively inefficient (it much do some sort of string lookup when it is called and then box its result into an object (which we then have to cast). This is no horrific (as it would be if we had to deserialize the data blob ourselves), but is not unlike the string parsing you do when processing a CSV file, which we would like to avoid.
- There is also a discovery problem. How do we know that the provider 'Microsoft-Windows-Kernel-Process' event exists, and how did we know that the 0x10 keyword was what we wanted? Thus this example alone is really not sufficient, we need to understand what providers are out there and what keywords they have. How do we do this?
The answer to the first problem is to generate a provider-specific TraceEventParser at compile time. That is what we want is to have something that takes a provider (or more specifically a description of all the events in a provider called the manifest), and generates code that knows how to parse THOSE PARTICULAR EVENTS. Now you just link in that code, and the you can now get a much better experience, where intellisense works and each event knows the fields that are valid. We have a tool called 'TraceParserGen' which does exactly this, which I will talk about in a future blog. In the mean time I will show you how to find the strings I used in the code above for yourself in this blog entry.
Then answer to the second point (how do we figure out what providers are out there and what events are in the provider) for today at least is the 'logman query providers' command.
You can find out all the providers that have been registered in the operating system by running the command
- logman query providers > providers.txt
It is a long list, which is why I redirected it to a file. Generally you care most about the providers that begin with 'Microsoft-' because these are the 'new' ETW providers. Most of the others are 'old' providers' and may not provide any useful information about how to enable them. It also does not include providers that did not publish themselves to the OS (EventSources DO NOT publish themselves an thus are not on the list). Thus the command above is pretty much only useful to find out what OS providers there are (which is still VERY useful).
There is a very useful variation of the command above. You can give it a -pid <num> argument
- logman query providers -pid 5400
Which looks for all USER MODE providers that CAN BE ENABLED in the process given. This will include all EVENTSOURCEes (however it will just show their GUID, so it is not super-helpful), and will NOT show KERNEL providers (they are implicitly available for all processes), but will show you the USER MODE OS providers that are available, which is still pretty handy.
Once you have a provider you are interested in, you can find out what Keywords and level it allows by specifying a provider name on the 'logman query providers' command. For example have doing a logman query providers and seeing Microsoft-Windows-Kernel-Process, we can guess that if we wanted to know about process stuff that this provider would probably do it. Thus we execute the command
- logman query providers Microsoft-Windows-Kernel-Process
And we get the output
Value Keyword Description
-------------------------------------------------------
0x0000000000000010 WINEVENT_KEYWORD_PROCESS
0x0000000000000020 WINEVENT_KEYWORD_THREAD
0x0000000000000040 WINEVENT_KEYWORD_IMAGE
0x0000000000000080 WINEVENT_KEYWORD_CPU_PRIORITY
0x0000000000000100 WINEVENT_KEYWORD_OTHER_PRIORITY
0x0000000000000200 WINEVENT_KEYWORD_PROCESS_FREEZE
Which shows us that the keyword 0x10 will get use the WINEVENT_KEYWORD_PROCESS events and the keyword 0x40 would get us the WINEVENT_KEYWORD_IMAGE, so if we cared about processes and image loads, setting the keyword 0x50 (the OR) should give us what we need.
Another pretty common technique is to just 'try it and see'. For example, once we were interested in Microsoft-Windows-Kernel-Process we simply 'try it and see' using PerfView.
- PerfView /onlyProviders:Microsoft-Windows-Kernel-Process collect
Let it run for a bit, and then look at the 'events' view in PerfView. By default if you simply specify a provider name in PerfView, it turns on ALL keywords and VERBOSE level, so you should get everything. you can then see what you got. Doing this for Microsoft-Windows-Kernel-Process we see the following in the events view
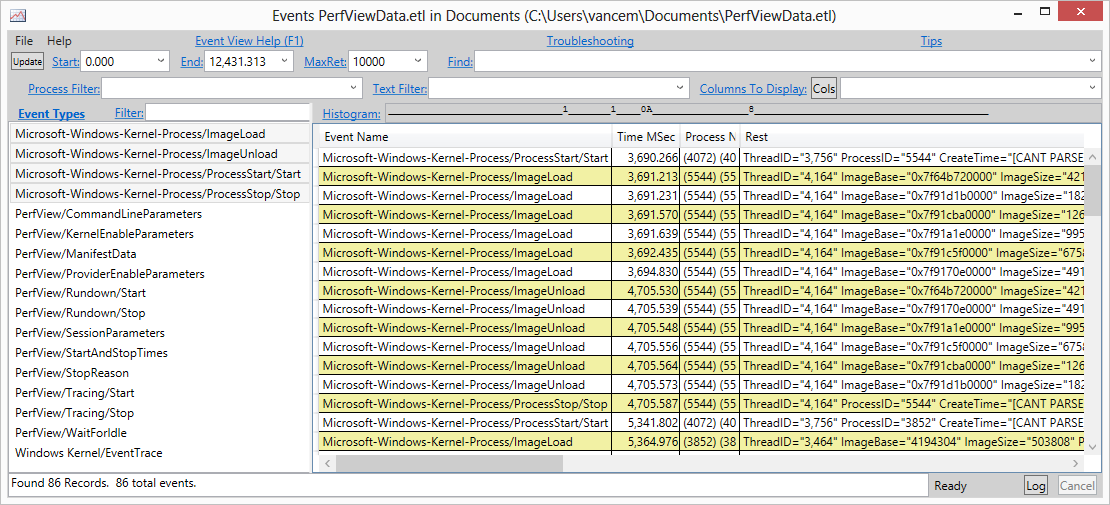
- That the Microsoft-Windows-Kernel-Process provider has 4 events. In PerfView an events is show as 'Provider/Task/Opcode' so the first event in that display has a 'TaskName' of 'ImageLoad' and an empty opcode (Info). We also see the event with the 'ProcessStart' TaskName and the OpcodeName of 'Start'. These are probably of interest
- Looking at particular exmaples we see that a ProcessStart/Start event has fields like 'ParentProcessID' and 'ImageStart' and that the ProcessStop/Stop event has fields like 'ExitCode' and 'CPUCycleCount'. This is how we know what strings to pass to 'PayloadByName'.
It is possible to probe this information at runtime (if you just to a ToString() on a TraceEvent, it will dump a XML representation of all the fields of the event into the returned string). There are also the 'PayloadNames' property that tell you all the legal values to pass to 'PayloadByName'. Typically, it is easier to simply 'try it an see' in PerfView, however.
So there you have it, You are now armed with the ability to go data mining for all the interesting events in the ETW system. Keep in mind however, that for kernel events, your first reactions should be to explore the KernelTraceEventParser, because it is already got a nice, efficient, strongly typed wrapper. However if it is not there, You can use RegisteredTraceEventParser to decode it. Couple this with the ability to also see your EventSources, and things start to get very exciting...
So now its your turn. Open the ProcessMonitor.ZIP file attached, drag it to your machine, open it in Visual Studio and take a look (it has lots of comments I omitted above). Play around with it (try other providers, and keywords, Play with image load events or file open events).
Vance
Comments
Anonymous
March 12, 2013
As always, another post containing great information. In prior attempts I've tried collecting data into multiple ETL files and then merging the files. The information you presented here sounds like a much better approach. Really liking what I've seen coming from the .NET runtime and P&P (SLAB) groups.Anonymous
March 17, 2013
Thanks for these valueable posts. I am using ETWTraceEventSource to read events from a log file, but I am unable to find the keyword settings on the TraceEvent instances.Anonymous
March 17, 2013
I am not certain exactly what you mean by 'keyword settings', and exactly when you want to get at the information. There is a property on TraceEvent (which represents a particular event being read) and it does have a property called 'Keyword' which is the bitset of keyword groups that that particular event belongs to. Is that what you are looking for?Anonymous
March 18, 2013
I realized that the 'Keyword' property may not be exposed in the version of TraceEvent that you have. The code is simple enough, if you really need it and are willing to download and build it from bcl.codeplex.com. public TraceEventKeyword Keyword { get { return (TraceEventKeyword)eventRecord->EventHeader.Keyword; } } Typically however you don't to know the keywords at event consumption time (they have already served their purpose.Anonymous
April 19, 2013
Aha! Figured out how to extend this to the kernel tracer by going through the TraceEvent source code in more detail -- the trick is to make a call to EnableKernelProvider rather than EnableProvider, and ensure the correct DLLs are present.Anonymous
February 24, 2015
I appreciate the help you have given.. I am struggling to get real time ETW trace using "TraceEventSession.EnableProvider" function for "TaskScheduledArgsTraceData" ...Do not know how to register for the event using .. Which TraceEventParser to use?Anonymous
February 24, 2015
The TaskScheduledArgs is defined as part of the TplEtwProviderTraceEventParser, so that is the the parser you would register. To subscribe to the events you need to turn on that EventSource (you can use the TplEtwProviderTraceEventParser.ProviderGuid for that. The 'Tasks' keyword (0x2), is probably the only keyword you actually need (you can get a list of the manifest by dumping the 'manifest' event associated with it in PerfView).Anonymous
March 02, 2015
Deeply grateful for your prompt reply VanceAnonymous
March 04, 2015
I want to get to know about methods called by processes by using StackWalk I am using KernelProvider I am not able to get StackWalkTraceData It is giving me exception - object reference not set to an instance of an object for CallStack().CodeAddress.Address, given I am able to get all other information like pid, process name etc from StackWalkTraceData .. Am I doing something wrong ? Part of code is as follows.. registeredParser.StackWalk += StackWalk_action; //RegisteredParser is KernelProvider Action<StackWalkTraceData> StackWalk_action = delegate(StackWalkTraceData data) { try { Console.WriteLine("Address: " +data.CallStack().CodeAddress.Address;Anonymous
March 04, 2015
First, pretty much all the methods/properties you are using are allowed to return null when they can't do what you want them to do. That is why you are getting the null reference exception because you are not checking for null Second, are you using a TraceLog or a ETWTraceEventSource to capture data? I suspect it is the later, which means that .CallStack() is probably uniformly returning null (since call stacks are only supported on TraceLogs NOT EtwTraceEventSource. Third, generally speaking you should not be looking at StackWalkTraceData. This is an event that the kernel uses to log stacks for OTHER events, and CallStack() is designed to work on the event that callstack is for. Thus calling it on a StackWalk event should always return null since stackwalk events don't have stack walks associated with themselves. Finally, stacks are not trivial. You probably want to turn the addresses into actual symbolic names (or at least find out what DLL they are associated with. This is more difficult for .NET code (which may be JIT compiled). This is the 'magic' that TraceLog provides. If you pick up the TraceEventSamples Nuget package (see blogs.msdn.com/.../walk-through-getting-started-with-etw-traceevent-nuget-samples-package.aspx) there are two samples of using stackwalks (one file based and the other real time (which is experimental at this point)). I strongly advise you to start with these and the morph them to what you are interested in.Anonymous
March 05, 2015
Thank you very much Vance for your prompt and thoroughly analyzing reply..I got the direction.Anonymous
March 06, 2015
Can I use ETW to get event trace related to windows messages passed to processes? .. This may be useful in automated test case creations..Anonymous
March 06, 2015
@Kashinath: I don't know any events fired when GUI event are processed at the lowest levels. Frameworks like WPF do have such events (see Microsoft-Windows-XAML).Anonymous
March 07, 2015
@Vance Thank you..Your support has given me great appreciation for Windows and ETW technology.Anonymous
May 15, 2015
I am trying to make a very simple proof of concept out-of-process ETW logger for custom events. I have some hacked up code that sort of works. -- Copied below I have two main questions: 1) What suggestion do you have to make PayloadByName (in UnhandledEvents) work?? The data.Dump() has the event, and has things like 'ProviderName', 'eventID', but what I am really after is the payload. 2) Lines 28 and 29 are where I am trying to set up a parser. I have not seen instructions or examples on setting up custom parsers. Is there someplace I can find instructions/examples?? Thanks!! Bill Source code: using Microsoft.Diagnostics.Tracing; using Microsoft.Diagnostics.Tracing.Parsers; using Microsoft.Diagnostics.Tracing.Session; using System; class Program { static void Main() { // create a real time user mode session using (var session = new TraceEventSession("ObserveProcs", null)) { // Set up Ctrl-C to stop the session Console.CancelKeyPress += (object s, ConsoleCancelEventArgs args) => session.Stop(); session.Source.UnhandledEvents += delegate(TraceEvent data) { if ((int) data.ID != 0xFFFE) { Console.WriteLine("Got Unhandled Event: " + data.Dump()); Console.WriteLine("And the value of ProviderName is: " + (string) data.PayloadByName("ProviderName")); } }; using (var source = new ETWTraceEventSource("TestSession", TraceEventSourceType.Session)) { var parser = new DynamicTraceEventParser(source); parser.All += delegate(TraceEvent data) { Console.WriteLine("Got Event: " + data.ToString()); }; } // Turn on the process events (includes starts and stops). session.EnableProvider("IMBillsWebLog"); session.Source.Process(); // Listen (forever) for events } } } Result at Console.WriteLine("Got Unhandled Event: " + data.Dump()); -- value of "data" copied below: {<Event MSec="217309.1200" PID="8912" PName= "" TID="3548" IsClassic="False" ProviderName="Provider(77aba46d-702d-5569-c9e4-df981f987aac)" eventID="1" TaskName="EventID(1)" TaskNum="65,533" OpcodeNum="0" Version="0" Level="4" PointerSize="4" EventDataLength="14"> 0: 73 0 6f 0 6d 0 65 0 | 49 0 64 0 0 0 s.o.m.e. I.d... </Event> }Anonymous
May 15, 2015
Regarding my question/code -- I noticed that it looks like Microsoft Trace Event Library 1.0.29 was published on NuGet today ( 5-15-2015 ). The smaller example code in the readme file works well.Anonymous
May 18, 2015
@BillH You may have already got what you need. You should read the 'TraceEvent Programmers Guide' (bing it) to understand about parsing. Fundamentally you have to use some sort of a parser to get at the payload (typically Dynamic or Registered). There are ways of making your own parsers for particular ETW providers (this is what a tool called TraceParserGen does). Currently, however that tool is not really supported (I may blog about it at some point in the future). Until then you can use the Payload* properties to parse events.Anonymous
October 26, 2015
Vance, I'm looking for some advice on how to use the TraceEventSession in a single process, but selectively enable/disable an event source that is in a share assembly among a number of processes on the computer. Ideally, I could enable/disable an event source by process id. Is this possible?Anonymous
October 26, 2015
If you are on Win8 or above, ETW and TraceEvent do support the ability to turn on providers by process name or process ID. See the TraceEventProviderOptions argument of EnableProvider. Let me know if you run into issues. If you have to work on Win7, you can still do that, but you have to create a custom command for your EventSource that you wish to turn on and off like this selectively. Let me know if this is what you need and I can provide details.Anonymous
October 27, 2015
Vance! Thanks for the reply. Our target machines are Windows7.Anonymous
October 27, 2015
In general whenever something sends a command to an EventSource, the virtual method 'OnEventCommand' gets called. If you override this method you basically can do extra logic with respect to commands. To implement per-process filtering you could define an argument called 'ProcessID', and the OnEventCommand could check for this argument, and if it is present and it does match the current Process ID it could use the 'DisableEvent' method on the EventCommandEventArgs, to turn off all events for the provider (keep calling it from event 1, until it returns false).Anonymous
October 27, 2015
Seems like you've thought of just about everything! Just tested it out and the OnEventCommand does get tripped. Is there any more control other than DisableEvent(int) within an EventSource? E.g. Enable the event source at a specific severity level and/or keywords similar to how an in-process EventListener works? I'm trying to move away from having event listeners in each process and use a standalone TraceEventSession per computer.Anonymous
October 27, 2015
Vance, Since I need to enable/disable events based on severity and/or keyword within the OnEventCommand, is there a stable/valid way to get at the m_eventData member of the EventSource that's handling the OnEventCommand callback? I'll need to interrogate this member to determine what events should be disabled based on the Level and Keyword info of m_eventDataAnonymous
October 27, 2015
Vance, What is the limit to the "value" of the KeyValuePair collection that can be sent in the TraceEventSession::EnableProvider. I'm sending in a payload of XML and an exception is thrown: The output byte buffer is too small to contain the encoded data, encoding 'Unicode (UTF-8)' fallback 'System.Text.EncoderReplacementFallback'.Anonymous
October 27, 2015
EventSource talking to EventListener don't have a size limitation, however if the events go on to ETW, there is a 64K (a little less actually) limit on payload size. It sounds like you are running into this limitation.Anonymous
October 27, 2015
Vance, Can I get some feedback on my earlier question about using reflection on the m_eventData private member of the EventSource? I would need to reflect on that member within the OnEventCommand callback if I am to properly filter shared event sources by severity.Anonymous
October 27, 2015
You should pretty much never be using reflection over private data. You are violating abstraction boundaries. Note that EventSource ALREADY sets the enable or disable according to the Verbosity and Keywords, so if you are happy with that, you should do NOTHING. In your case (where you simply want to turn things off more), you can simply disable the events (and leave it alone if you want it to work as normal)Anonymous
October 27, 2015
Thx for reply, I understand it's a kludge. What I am trying to work around is a single TraceEventSession, and multiple processes sharing the same EventSource but each instance of the EventSource having a different minimum eventing level chosen at runtime. I don't want implementing EventSources to respond to the OnEventCommand and issue EventCommandEventArgs::DisableCommand(###) for every event that exists in the file, I'd like this behavior to happen in the base EventSource class where the instruction of the command is just the minimum eventing level. I see this as totally do-able because m_eventData has all the information I need at run-time. It's too bad it's private.Anonymous
October 28, 2015
Hi Vance, Can you please advise on the two "EnableProvider" methods in TraceEventSession being marked as obsolete that accept IEnumerable<KeyValuePair<string,string>>? Those two methods (based on your suggestion) send the key value pair data to the EventSource's OnEventCommand. Is there an alternative way of sending the KeyValuePairs to the EventSource?Anonymous
October 28, 2015
The Obsolete message on the overloads of TraceEventSession.EnableProvider should have pointed you at the Overload that took a TraceEventProviderOptions. This provder-options object has an 'Arguments' property (and an AddArgument method), that allows you to pass key-value pairs. No functionality is lost, this is just factoring it so that all the options are on the providerOptions object.Anonymous
October 30, 2015
Hi Vance, When an EventSource that's used among multiple processes is received by a TraceEventSession, is there any way to differentiate the EventSource other than the ProcessID property of the TraceEvent? Ideally (for me) the EventSource running in each process could identify itself with a given token, and that token would be available in the TraceEvent received by the TraceEventSession. I see the ActivityID property in the TraceEvent - is there a way all events coming out of an EventSource can have the ActivityID set?Anonymous
October 30, 2015
@ajhuddymsdn It is not clear to me why process ID is not exactly what you want. After all it is an ID that unambiguously distinguishes that source from all the others running in different processes. Why is using processID a problem. As far as activity IDs go you should look at blogs.msdn.com/.../exploring-eventsource-activity-correlation-and-causation-features.aspx. However ActivityIDs are for finer grained grouping (e.g. a single request, or a single chunk of work within a request) because of this they have a parent-child structure to them that the target needs to be aware of (you won't always get the same ID within a request (since it could have spawned sub-activities).Anonymous
October 30, 2015
The ProcessID will be fine, there is just a scenario I have to deal with where a process will start, write a number of events quickly, then quit. Since the TraceEventSession gets the events in bursts, the ProcessID in some cases can't be looked up.Anonymous
October 30, 2015
@ajhuddymsdn - if you turn on Microsoft-Windows-Kernel-Process (or better the Process Kernel events) you will get events that will fire when processes begin and end so can never 'miss' an fast running process (to for example map process IDs to names). . You really need this because process IDs can be reused, so you need to know if the ID has 'died' (and reused). However this issue is independent of the goal of having an ID for your EventSources. After all ActivityIDs will not have a nice symbolic name either, they are just a big GUID (or path of numbers).- Anonymous
August 11, 2016
There appears to be a problem with the parsing of events from Microsoft-Windows-Kernel-Network provider.The daddr, saddr, dport, and sport fields show negative values, and it appears to be unable to parse ipv6 at allHere is a sample from simply using "data.ToString()" in the action callback...IPV4IPV6Do you have any advice to deal with this matter?
- Anonymous