Enhance resilience by replicating your Log Analytics workspace across regions (Preview)
Replicating your Log Analytics workspace across regions enhances resilience by letting you switch over to the replicated workspace and continue operations if there's a regional failure. This article explains how Log Analytics workspace replication works, how to replicate your workspace, how to switch over and back, and how to decide when to switch between your replicated workspaces.
Here's a video that provides a quick overview of how Log Analytics workspace replication works:
Important
Although we sometimes use the term failover, for example in the API call, failover is also commonly used to describe an automatic process. Therefore, this article uses the term switchover to emphasize that the switch to the replicated workspace is an action you trigger manually.
Permissions required
| Action | Permissions required |
|---|---|
| Enable workspace replication | Microsoft.OperationalInsights/workspaces/write permissions to the Log Analytics workspace, as provided by the Log Analytics Contributor built-in role, for example |
| Switch over and switch back (trigger failover and failback) | Microsoft.OperationalInsights/workspaces/write permissions to the Log Analytics workspace at the resource group level, as provided by the Log Analytics Contributor built-in role, for example |
| Check workspace state | Microsoft.OperationalInsights/workspaces/read permissions to the Log Analytics workspace, as provided by the Log Analytics Reader built-in role, for example |
How Log Analytics workspace replication works
Your original workspace and region are referred to as the primary. The replicated workspace and alternate region are referred to as the secondary.
The workspace replication process creates an instance of your workspace in the secondary region. The process creates the secondary workspace with the same configuration as your primary workspace, and Azure Monitor automatically updates the secondary workspace with any future changes you make to your primary workspace configuration.
The secondary workspace is a "shadow" workspace for resiliency purposes only. You can’t see the secondary workspace in the Azure portal, and you can't manage or access it directly.
When you enable workspace replication, Azure Monitor sends new logs ingested to your primary workspace to your secondary region also. Logs you ingest to the workspace before you enable workspace replication aren’t copied over.
If an outage affects your primary region, you can switch over and reroute all ingestion and query requests to your secondary region. After Azure mitigates the outage and your primary workspace is healthy again, you can switch back over to your primary region.
When you switch over, the secondary workspace becomes active and your primary becomes inactive. Azure Monitor then ingests new data through the ingestion pipeline in your secondary region, rather than the primary region. When you switch over to your secondary region, Azure Monitor replicates all data you ingest from the secondary region to the primary region. The process is asynchronous and doesn't affect your ingestion latency.
Important
After you switch over to the secondary region, if the primary region can't process incoming log data, Azure Monitor buffers the data in the secondary region for up to 11 days. During the first four days, Azure Monitor automatically reattempts to replicate the data periodically.

Supported regions
Workspace replication is currently supported for workspaces in a limited set of regions, organized by region groups (groups of geographically adjacent regions). When you enable replication, select a secondary location from the list of supported regions in the same region group as the workspace primary location. For example, a workspace in West Europe can be replicated in North Europe, but not in West US 2, since these regions are in different region groups.
These region groups and regions are currently supported:
| Region group | Regions | Notes |
|---|---|---|
| North America | East US | Replication isn't supported to or from the East US 2 region. |
| East US 2 | Replication isn't supported to or from the East US region. | |
| West US | ||
| West US 2 | ||
| Central US | ||
| South Central US | ||
| Central Canada | ||
| Europe | West Europe | |
| North Europe | ||
| South UK | ||
| West UK | ||
| Germany West Central | ||
| France Central |
Data residency requirements
Different customers have different data residency requirements, so it's important that you control where your data is stored. Azure Monitor processes and stores logs in the primary and secondary regions that you choose. For more information, see Supported regions.
Support for Sentinel and other services
Various services and features that use Log Analytics workspaces are compatible with workspace replication and switchover. These services and features continue to work when you switch over to the secondary workspace.
For example, regional network issues that cause log ingestion latency can impact Sentinel customers. Customers that use replicated workspaces can switch over to their secondary region to continue working with their Log Analytics workspace and Sentinel. However, if the network issue impacts the Sentinel service health, switching to another region doesn't mitigate the issue.
Some Azure Monitor experiences, including Application Insights and VM Insights, are currently only partially compatible with workspace replication and switchover. For the full list, see Restrictions and limitations.
Enable and disable workspace replication
You enable and disable workspace replication by using a REST command. The command triggers a long running operation, which means that it can take a few minutes for the new settings to apply. After you enable replication, it can take up to one hour for all tables (data types) to begin replicating, and some data types might start replicating before others. Changes you make to table schemas after you enable workspace replication - for example, new custom log tables or custom fields you create, or diagnostic logs set up for new resource types - can take up to one hour to start replicating.
Important
Replication of Log Analytics workspaces linked to a dedicated cluster is currently not supported.
Enable workspace replication
To enable replication on your Log Analytics workspace, use this PUT command:
PUT

https://management.azure.com/subscriptions/<subscription_id>/resourcegroups/<resourcegroup_name>/providers/microsoft.operationalinsights/workspaces/<workspace_name>?api-version=2023-01-01-preview

body:
{
    "properties": {
        "replication": {
            "enabled": true,
            "location": "<secondary_region>"
        }
    },
    "location": "<primary_region>"
}
Where:
<subscription_id>: The subscription ID related to your workspace.<resourcegroup_name>: The resource group that contains your Log Analytics workspace resource.<workspace_name>: The name of your workspace.<primary_region>: The primary region for your Log Analytics workspace.<secondary_region>: The region in which Azure Monitor creates the secondary workspace.
For the supported location values, see Supported regions.
The PUT command is a long running operation that can take some time to complete. A successful call returns a 200 status code. You can track the provisioning state of your request, as described in Check request provisioning state.
Check request provisioning state
To check the provisioning state of your request, run this GET command:
GET

https://management.azure.com/subscriptions/<subscription_id>/resourceGroups/<resourcegroup_name>/providers/Microsoft.OperationalInsights/workspaces/<workspace_name>?api-version=2023-01-01-preview
Where:
<subscription_id>: The subscription ID related to your workspace.<resourcegroup_name>: The resource group that contains your Log Analytics workspace resource.<workspace_name>: The name of your Log Analytics workspace.
Use the GET command to verify that the workspace provisioning state changes from Updating to Succeeded, and the secondary region is set as expected.
Note
When you enable replication for workspaces that interact with Sentinel, it can take up to 12 days to fully replicate Watchlist and Threat Intelligence data to the secondary workspace.
Associate data collection rules with the system data collection endpoint
You use data collection rules (DCR) to collect log data using Azure Monitor Agent and the Logs Ingestion API.
If you have data collection rules that send data to your primary workspace, you need to associate the rules to a system data collection endpoint (DCE), which Azure Monitor creates when you enable workspace replication. The name of the system data collection endpoint is identical to your workspace ID. Only data collection rules you associate to the workspace's system data collection endpoint enable replication and switchover. This behavior lets you specify the set of log streams to replicate, which helps you control your replication costs.
To replicate data you collect using data collection rules, associate your data collection rules to the system data collection endpoint for your Log Analytics workspace:
In the Azure portal, select Data collection rules.
From the Data collection rules screen, select a data collection rule that sends data to your primary Log Analytics workspace.
On the data collection rule Overview page, select Configure DCE and select the system data collection endpoint from the available list:
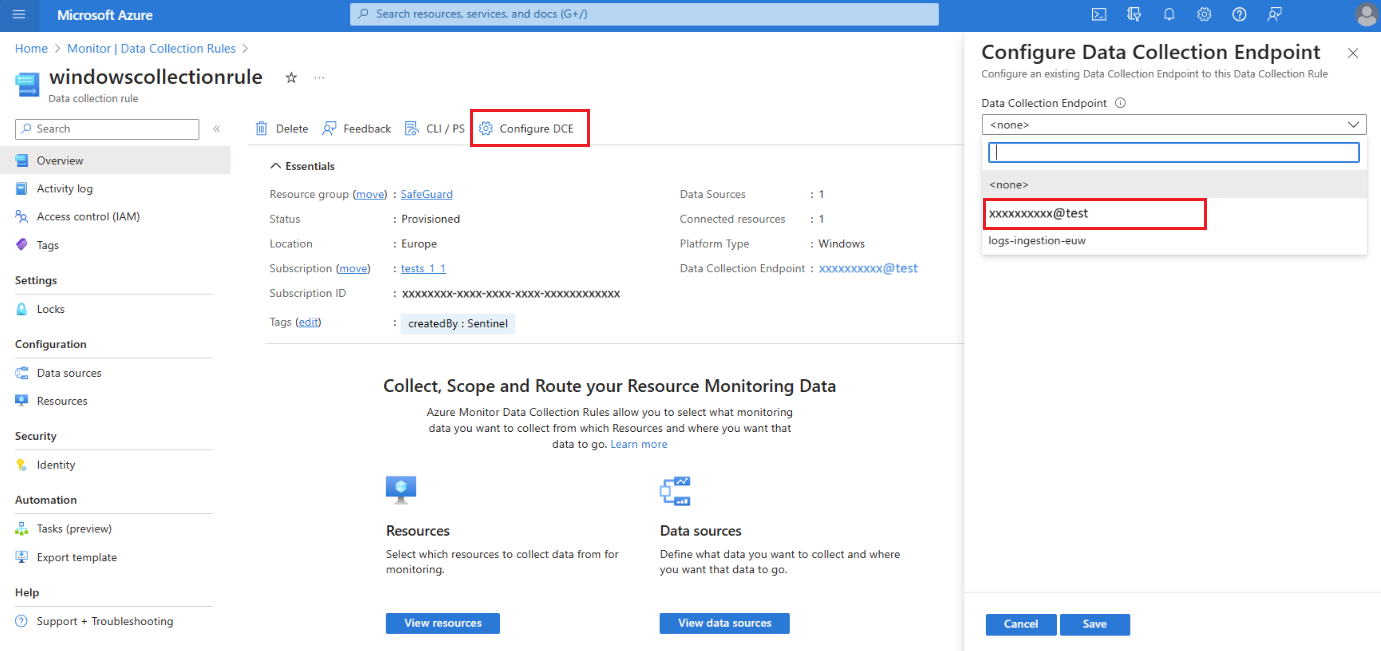 For details about the System DCE, check the workspace object properties.

Important
Data collection rules connected to a workspace's system data collection endpoint can target only that specific workspace. The data collection rules must not target other destinations, such as other workspaces or Azure Storage accounts.
Disable workspace replication
To disable replication for a workspace, use this PUT command:
PUT

https://management.azure.com/subscriptions/<subscription_id>/resourcegroups/<resourcegroup_name>/providers/microsoft.operationalinsights/workspaces/<workspace_name>?api-version=2023-01-01-preview

body:
{
    "properties": {
        "replication": {
            "enabled": false
        }
    },
    "location": "<primary_region>"
}
Where:
<subscription_id>: The subscription ID related to your workspace.<resourcegroup_name>: The resource group that contains your workspace resource.<workspace_name>: The name of your workspace.<primary_region>: The primary region for your workspace.
The PUT command is a long running operation that can take some time to complete. A successful call returns a 200 status code. You can track the provisioning state of your request, as described in Check request provisioning state.
Monitor workspace and service health
Ingestion latency or query failures are examples of issues that can often be handled by failing over to your secondary region. Such issues can be detected by using Service Health notifications and log queries.
Service Health notifications are useful for service-related issues. To identify issues impacting your specific workspace (and possibly not the entire service), you can use other measures:
- Create alerts based on the workspace resource health
- Set your own thresholds for workspace health metrics
- Create your own monitoring queries to serve as custom health indicators for your workspace, as described in Monitor workspace performance using queries, to:
- Measure ingestion latency per table
- Identify whether the source of latency is the collection agents or the ingestion pipeline
- Monitor ingestion volume anomalies per table and resource
- Monitor query success rate per table, user, or resource
- Create alerts based on your queries
Note
You can also use log queries to monitor your secondary workspace, but keep in mind that logs replication is done in batch operations. The measured latency can fluctuate and doesn't indicate any health issue with your secondary workspace. For more information, see Audit the inactive workspace.
Switch over to your secondary workspace
During switchover, most operations work the same as when you use the primary workspace and region. However, some operations have slightly different behavior or are blocked. For more information, see Restrictions and limitations.
When should I switch over?
You decide when to switch over to your secondary workspace and switch back to your primary workspace based on ongoing performance and health monitoring and your system standards and requirements.
There are several points to consider in your plan for switchover, as described in the following subsections.
Issue type and scope
The switchover process routes ingestion and query requests to your secondary region, which usually bypasses any faulty component that's causing latency or failure in your primary region. As a result, switchover isn't likely to help if:
- There's a cross-regional issue with an underlying resource. For example, if the same resource types fail in both your primary and secondary regions.
- You experience an issue related to workspace management, such as changing workspace retention. Workspace management operations are always handled in your primary region. During switchover, workspace management operations are blocked.
Issue duration
Switchover isn't instantaneous. The process of rerouting requests relies on DNS updates, which some clients pick up within minutes while others can take more time. Therefore, it's helpful to understand whether the issue can be resolved within a few minutes. If the observed issue is consistent or continuous, don't wait to switch over. Here are some examples:
Ingestion: Issues with the ingestion pipeline in your primary region can affect data replication to your secondary workspace. During switchover, logs are instead sent to the ingestion pipeline in the secondary region.
Query: If queries in your primary workspace fail or timeout, Log search alerts can be affected. In this scenario, switch over to your secondary workspace to make sure all your alerts are triggered correctly.
Secondary workspace data
Logs ingested to your primary workspace before you enable replication aren't copied to the secondary workspace. If you enabled workspace replication three hours ago and you now switch over to your secondary workspace, your queries can only return data from the last three hours.
Before you switch regions during switchover, your secondary workspace needs to contain a useful volume of logs. We recommend waiting at least one week after you enable replication before you trigger switchover. The seven days allow for sufficient data to be available in your secondary region.
Trigger switchover
Before you switch over, confirm that the workspace replication operation completed successfully. Switchover only succeeds when the secondary workspace is configured correctly.
To switch over to your secondary workspace, use this POST command:
POST
https://management.azure.com/subscriptions/<subscription_id>/resourceGroups/<resourcegroup_name>/providers/Microsoft.OperationalInsights/locations/<secondary_region>/workspaces/<workspace_name>/failover?api-version=2023-01-01-preview
Where:
<subscription_id>: The subscription ID related to your workspace.<resourcegroup_name>: The resource group that contains your workspace resource.<secondary_region>: The region to switch to during switchover.<workspace_name>: The name of the workspace to switch to during switchover.
The POST command is a long running operation that can take some time to complete. A successful call returns a 202 status code. You can track the provisioning state of your request, as described in Check request provisioning state.
Switch back to your primary workspace
The switchback process cancels the rerouting of queries and log ingestion requests to the secondary workspace. When you switch back, Azure Monitor goes back to routing queries and log ingestion requests to your primary workspace.
When you switch over to your secondary region, Azure Monitor replicates logs from your secondary workspace to your primary workspace. If an outage impacts the log ingestion process in the primary region, it can take time for Azure Monitor to complete the ingestion of the replicated logs to your primary workspace.
When should I switch back?
There are several points to consider in your plan for switchback, as described in the following subsections.
Log replication state
Before you switch back, verify that Azure Monitor has completed replicating all logs ingested during switchover to the primary region. If you switch back before all logs replicate to the primary workspace, your queries might return partial results until log ingestion completes.
You can query your primary workspace in the Azure portal for the inactive region, as described in Audit the inactive workspace.
Primary workspace health
There are two important health items to check in preparation for switchback to your primary workspace:
- Confirm there are no outstanding Service Health notifications for the primary workspace and region.
- Confirm your primary workspace is ingesting logs and processing queries as expected.
For examples of how to query your primary workspace when your secondary workspace is active and bypass the rerouting of requests to your secondary workspace, see Audit the inactive workspace.
Trigger switchback
Before you switch back, confirm the Primary workspace health and complete replication of logs.
The switchback process updates your DNS records. After the DNS records update, it can take time for all clients to receive the updated DNS settings and resume routing to the primary workspace.
To switch back to your primary workspace, use this POST command:
POST

https://management.azure.com/subscriptions/<subscription_id>/resourceGroups/<resourcegroup_name>/providers/Microsoft.OperationalInsights/workspaces/<workspace_name>/failback?api-version=2023-01-01-preview
Where:
<subscription_id>: The subscription ID related to your workspace.<resourcegroup_name>: The resource group that contains your workspace resource.<workspace_name>: The name of the workspace to switch to during switchback.
The POST command is a long running operation that can take some time to complete. A successful call returns a 202 status code. You can track the provisioning state of your request, as described in Check request provisioning state.
Audit the inactive workspace
By default, Azure Monitor run queries in your active region. The active region is typically your primary region in your primary workspace. During switchover, the secondary workspace becomes active and the primary region is inactive.
In some cases, you might want to query the inactive region. For example, you might want to ensure that your secondary workspace has complete replication of ingested logs before you switch over.
Query inactive region
To query the available logs on the inactive workspace:
In the Azure portal, go to your Log Analytics workspace.
On the left, select Logs.
On the query toolbar, select More tools (...) at the right.
Enable Query inactive region.
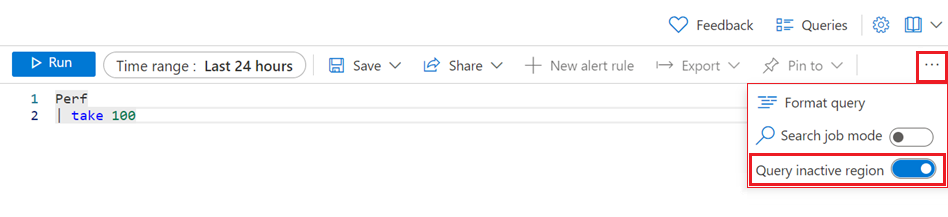

After you enable the Query inactive region option, Log Analytics shows query results for the inactive region rather than the active region.
You can confirm that Azure Monitor runs your query in the intended region by checking these fields in the LAQueryLogs table, which is created when you enable query auditing in your Log Analytics workspace:
isWorkspaceInFailover: Indicates whether the workspace was in switchover mode during the query. The data type is Boolean (True, False).workspaceRegion: The region of the workspace targeted by the query. The data type is String.
Monitor workspace performance using queries
We recommend using the queries in this section to create alert rules that notify you of possible workspace health or performance issues. However, the decision to switch over requires your careful consideration, and shouldn't be done automatically.
In the query rule, you can define a condition to switch over to your secondary workspace after a specified number of violations. For more information, see Create or edit a log search alert rule.
Two significant measurements of workspace performance include ingestion latency and ingestion volume. The following sections explore these monitoring options.
Monitor end-to-end ingestion latency
Ingestion latency measures the time it takes to ingest logs to the workspace. The time measurement starts when the initial logged event occurs and ends when the log is stored in your workspace. The total ingestion latency is composed of two parts:
- Agent latency: The time required by the agent to report an event.
- Ingestion pipeline (backend) latency: The time required for the ingestion pipeline to process the logs and write them to your workspace.
Different data types have different ingestion latency. You can measure ingestion for each data type separately, or create a generic query for all types, and a more fine-grained query for specific types that are of higher importance to you. We suggest you measure the 90th percentile of the ingestion latency, which is more sensitive to change than the average or the 50th percentile (median).
The following sections show how to use queries to check the ingestion latency for your workspace.
Evaluate baseline ingestion latency of specific tables
Begin by determining the baseline latency of specific tables over several days.
This example query creates a chart of the 90th percentile of ingestion latency on the Perf table:
// Assess the ingestion latency baseline for a specific data type
Perf
| where TimeGenerated > ago(3d)
| project TimeGenerated,
IngestionDurationSeconds = (ingestion_time()-TimeGenerated)/1s
| summarize LatencyIngestion90Percentile=percentile(IngestionDurationSeconds, 90) by bin(TimeGenerated, 1h)
| render timechart
After you run the query, review the results and rendered chart to determine the expected latency for that table.
Monitor and alert on current ingestion latency
After you establish the baseline ingestion latency for a specific table, create a log search alert rule for the table based on changes in latency over a short period of time.
This query calculates ingestion latency over the past 20 minutes:
// Track the recent ingestion latency (in seconds) of a specific table
Perf
| where TimeGenerated > ago(20m)
| extend IngestionDurationSeconds = (ingestion_time()-TimeGenerated)/1s
| summarize Ingestion90Percent_seconds=percentile(IngestionDurationSeconds, 90)
Because you can expect some fluctuations, create an alert rule condition to check if the query returns a value significantly greater than the baseline.
Determine the source of ingestion latency
When you notice your total ingestion latency is going up, you can use queries to determine whether the source of the latency is the agents or the ingestion pipeline.
This query charts the 90th percentile latency of the agents and of the pipeline, separately:
// Assess agent and pipeline (backend) latency
Perf
| where TimeGenerated > ago(1h)
| extend AgentLatencySeconds = (_TimeReceived-TimeGenerated)/1s,
	  PipelineLatencySeconds=(ingestion_time()-_TimeReceived)/1s
| summarize percentile(AgentLatencySeconds,90), percentile(PipelineLatencySeconds,90) by bin(TimeGenerated,5m)
| render columnchart
Note
Although the chart displays the 90th percentile data as stacked columns, the sum of the data in the two charts doesn't equal the total ingestion 90th percentile.
Monitor ingestion volume
Ingestion volume measurements can help identify unexpected changes to the total or table-specific ingestion volume for your workspace. The query volume measurements can help you identify performance issues with log ingestion. Some useful volume measurements include:
- Total ingestion volume per table
- Constant ingestion volume (standstill)
- Ingestion anomalies - spikes and dips in ingestion volume
The following sections show how to use queries to check the ingestion volume for your workspace.
Monitor total ingestion volume per table
You can define a query to monitor the ingestion volume per table in your workspace. The query can include an alert that checks for unexpected changes to the total or table-specific volumes.
This query calculates the total ingestion volume over the past hour per table in megabytes per second (MBs):
// Calculate total ingestion volume over the past hour per table
Usage
| where TimeGenerated > ago(1h)
| summarize BillableDataMB = sum(_BilledSize)/1.E6 by bin(TimeGenerated,1h), DataType
Check for ingestion standstill
If you ingest logs through agents, you can use the agent's heartbeat to detect connectivity. A still heartbeat can reveal a stop in logs ingestion to your workspace. When the query data reveals an ingestion standstill, you can define a condition to trigger a desired response.
The following query checks the agent heartbeat to detect connectivity issues:
// Count agent heartbeats in the last ten minutes
Heartbeat
| where TimeGenerated>ago(10m)
| count
Monitor ingestion anomalies
You can identify spikes and dips in your workspace ingestion volume data in various ways. Use the series_decompose_anomalies() function to extract anomalies from the ingestion volumes you monitor in your workspace, or create your own anomaly detector to support your unique workspace scenarios.
Identify anomalies using series_decompose_anomalies
The series_decompose_anomalies() function identifies anomalies in a series of data values. This query calculates the hourly ingestion volume of each table in your Log Analytics workspace, and uses series_decompose_anomalies() to identify anomalies:
// Calculate hourly ingestion volume per table and identify anomalies
Usage
| where TimeGenerated > ago(24h)
| project TimeGenerated, DataType, Quantity
| summarize IngestionVolumeMB=sum(Quantity) by bin(TimeGenerated, 1h), DataType
| summarize
    Timestamp=make_list(TimeGenerated),
    IngestionVolumeMB=make_list(IngestionVolumeMB)
    by DataType
| extend series_decompose_anomalies(IngestionVolumeMB)
| mv-expand
    Timestamp,
    IngestionVolumeMB,
    series_decompose_anomalies_IngestionVolumeMB_ad_flag,
    series_decompose_anomalies_IngestionVolumeMB_ad_score,
    series_decompose_anomalies_IngestionVolumeMB_baseline
| where series_decompose_anomalies_IngestionVolumeMB_ad_flag != 0
For more information about how to use series_decompose_anomalies() to detect anomalies in log data, see Detect and analyze anomalies using KQL machine learning capabilities in Azure Monitor.
Create your own anomaly detector
You can create a custom anomaly detector to support the scenario requirements for your workspace configuration. This section provides an example to demonstrate the process.
The following query calculates:
- Expected ingestion volume: Per hour, by table (based on the median of medians, but you can customize the logic)
- Actual ingestion volume: Per hour, by table
To filter out insignificant differences between the expected and the actual ingestion volume, the query applies two filters:
- Rate of change: Over 150% or under 66% of the expected volume, per table
- Volume of change: Indicates whether the increased or decreased volume is more than 0.1% of the monthly volume of that table
// Calculate expected vs actual hourly ingestion per table
let TimeRange=24h;
let MonthlyIngestionByType=
    Usage
    | where TimeGenerated > ago(30d)
    | summarize MonthlyIngestionMB=sum(Quantity) by DataType;
// Calculate the expected ingestion volume by median of hourly medians
let ExpectedIngestionVolumeByType=
    Usage
    | where TimeGenerated > ago(TimeRange)
    | project TimeGenerated, DataType, Quantity
    | summarize IngestionMedian=percentile(Quantity, 50) by bin(TimeGenerated, 1h), DataType
    | summarize ExpectedIngestionVolumeMB=percentile(IngestionMedian, 50) by DataType;
Usage
| where TimeGenerated > ago(TimeRange)
| project TimeGenerated, DataType, Quantity
| summarize IngestionVolumeMB=sum(Quantity) by bin(TimeGenerated, 1h), DataType
| join kind=inner (ExpectedIngestionVolumeByType) on DataType
| extend GapVolumeMB = round(IngestionVolumeMB-ExpectedIngestionVolumeMB,2)
| where GapVolumeMB != 0
| extend Trend=iff(GapVolumeMB > 0, "Up", "Down")
| extend IngestedVsExpectedAsPercent = round(IngestionVolumeMB * 100 / ExpectedIngestionVolumeMB, 2)
| join kind=inner (MonthlyIngestionByType) on DataType
| extend GapAsPercentOfMonthlyIngestion = round(abs(GapVolumeMB) * 100 / MonthlyIngestionMB, 2)
| project-away DataType1, DataType2
// Determine whether the spike/deep is substantial: over 150% or under 66% of the expected volume for this data type
| where IngestedVsExpectedAsPercent > 150 or IngestedVsExpectedAsPercent < 66
// Determine whether the gap volume is significant: over 0.1% of the total monthly ingestion volume to this workspace
| where GapAsPercentOfMonthlyIngestion > 0.1
| project
    Timestamp=format_datetime(todatetime(TimeGenerated), 'yyyy-MM-dd HH:mm:ss'),
    Trend,
    IngestionVolumeMB,
    ExpectedIngestionVolumeMB,
    IngestedVsExpectedAsPercent,
    GapAsPercentOfMonthlyIngestion
Monitor query success and failure
Each query returns a response code that indicates success or failure. When the query fails, the response also includes the error types. A high surge of errors can indicate a problem with the workspace availability or service performance.
This query counts how many queries returned a server error code:
// Count query errors
LAQueryLogs
| where ResponseCode>=500 and ResponseCode<600
| count
Restrictions and limitations
- Replication of Log Analytics workspaces linked to a dedicated cluster is currently not supported.
- The purge operation, which deletes records from a workspace, removes the relevant records from both the primary and the secondary workspaces. If one of the workspace instances isn't available, the purge operation fails.
- Replication of alert rules across regions is currently not supported. Since Azure Monitor supports querying the inactive region, query-based alerts continue to work when you switch between regions unless the Alerts service in the active region isn't working properly or the alert rules aren't available.
- When you enable replication for workspaces that interact with Sentinel, it can take up to 12 days to fully replicate Watchlist and Threat Intelligence data to the secondary workspace.
- During switchover, workspace management operations aren't supported, including:
- Change workspace retention, pricing tier, daily cap, and so on
- Change network settings
- Change schema through new custom logs or connecting platform logs from new resource providers, such as sending diagnostic logs from a new resource type
- The solution targeting capability of the legacy Log Analytics agent isn't supported during switchover. Therefore, during switchover, solution data is ingested from all agents.
- The failover process updates your Domain Name System (DNS) records to reroute all ingestion requests to your secondary region for processing. Some HTTP clients have "sticky connections" and might take longer to pick up the DNS updated DNS. During switchover, these clients might attempt to ingest logs through the primary region for some time. You might be ingesting logs to your primary workspace using various clients, including the legacy Log Analytics Agent, Azure Monitor Agent, code (using the Logs Ingestion API or the legacy HTTP data collection API), and other services, such as Sentinel.
The following features are partially supported or not currently supported:
| Feature | Support |
|---|---|
| Search jobs, Restore | Partially supported - Search job and restore operations create tables and populate them with search results or restored data. After you enable workspace replication, new tables created for these operations replicate to your secondary workspace. Tables populated before you enable replication aren't replicated. If these operations are in progress when you switch over, the outcome is unexpected. It might complete successfully but not replicate, or it might fail, depending on your workspace health and the exact timing. |
| Application Insights over Log Analytics workspaces | Not supported |
| VM Insights | Not supported |
| Container Insights | Not supported |
| Private links | Not supported during failover |