Microsoft Monetize - Dimensions, Metrics, Filtering, and Grouping
This page outlines how to design your reports so that you can:
Reduce the size of the data set by removing data you don't care about
Increase the relevance of the data you do get
Get your results more quickly; requesting smaller data sets often increases reporting performance
Every report returns a collection of data. In this document, this collection of data is referred to as a data set; these data sets are described in terms of dimensions and metrics.
Similarly, when you are configuring a report, you can choose to filter the data set.
The key recommendations of this document are as follows:
Filter out as much data as possible - smaller data is faster data
Choose as few dimensions as possible - the report automatically groups by all selected dimensions. The more dimensions you group by, the larger the data set becomes.
| Term | Definition |
|---|---|
| Dimensions | Dimensions are things the data set describes, such as advertisers, publishers, line items, or domains. In other words, dimensions are what the data set is about. |
| Filtering | Filtering removes dimensions you don't care about. This reduces the size of the data set. For example, you might want to see only those impressions that occurred on weekends in a certain region of France. Tip: Filter out as much irrelevant data as possible – smaller data is faster data. |
| Grouping | Reports automatically group by all selected dimensions. Grouping causes the dimensions to be output in a specific order. This can be useful for understanding relationships between dimensions. For example, you can see how the different line items under an advertiser are performing. Since the report automatically applies grouping to dimensions, selecting many dimensions can generate a very large data set. For every additional dimension you select, the data set becomes larger. Tip: Select as few dimensions as possible. The more dimensions you select, the larger the data set becomes. |
| Metrics | Metrics are numbers that measure the performance of the dimensions you've selected. Examples include: - How many impressions came through this publisher? - What is the click-through rate across this campaign's creatives? |
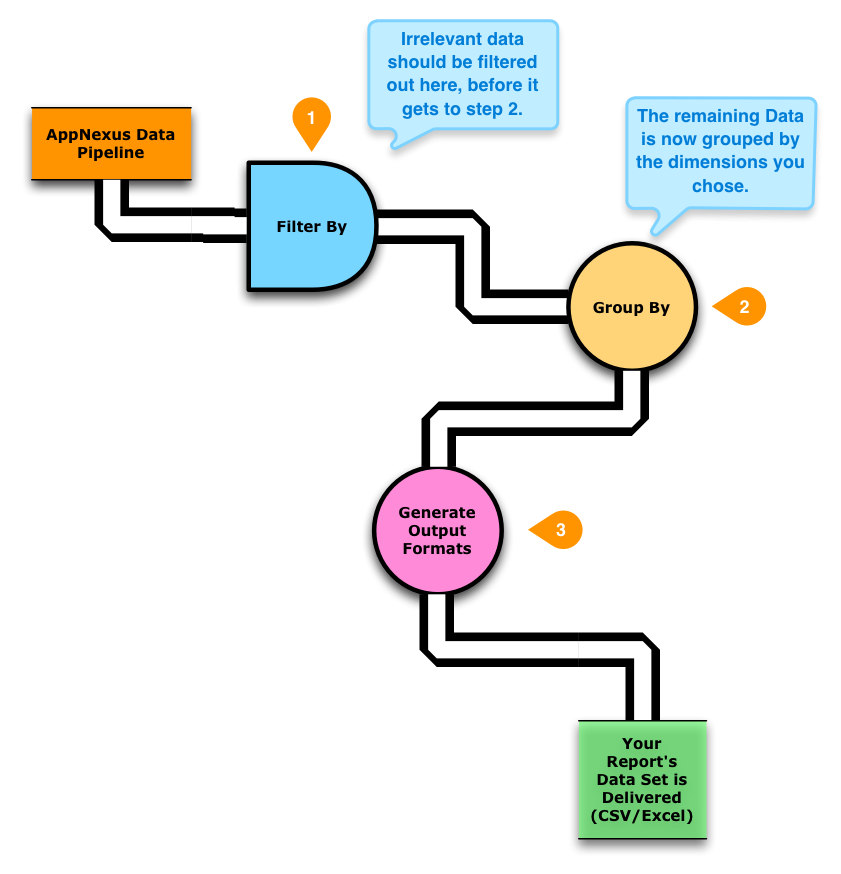
Visualizing the process
The diagram below gives a simplified view of the process that generates the data set that you receive.
In Step 1, unnecessary data is removed. This is important to keep your reports small and relevant. We recommend filtering out as much information as possible.
In Step 2, the data set is automatically grouped by the selected dimensions. This step can generate a large data set if you selected many dimensions. We recommend selecting as few dimensions as possible.
In Step 3, our systems generate the report. You have the option to view the report, have it run in the background or have it exported and emailed to you (in CSV or Excel format). This goes more quickly with smaller data sets.
A tiny example database
All of the examples below will use the same underlying "database", which contains two dimensions: Advertiser and Line Item; and two metrics: Impressions and Clicks. Here it is in its entirety:
| ID | Advertiser | Line Item | Impressions | Clicks |
|---|---|---|---|---|
| 1 | A | ACME Axe Co. | 1792 | 21 |
| 2 | A | ACME Axe Co. | 4355 | 34 |
| 3 | A | Bar-None Ice Cream Cones | 78,231 | 1408 |
| 4 | B | Candles R-US | 2843 | 65 |
| 5 | B | Doggie Accessories | 9486 | 123 |
| 6 | C | Evergreen Synthetic Xmas Trees | 2238 | 46 |
| 7 | D | Frog Hollow Athletic Socks | 8198 | 214 |
| 8 | D | Frog Hollow Athletic Socks | 103 | 12 |
| 9 | E | Best Soap & Candle | 3883 | 41 |
| 10 | E | Best Soap & Candle | 1292 | 183 |
| 11 | E | Best Soap & Candle | 902 | 81 |
| 12 | E | Best Soap & Candle | 5352 | 212 |
| 13 | F | Farmer Snowplows | 12,448 | 256 |
| 14 | F | Farmer Snowplows | 23,984 | 782 |
| 15 | F | Farmer Snowplows | 8,764 | 128 |
| 16 | G | Gretchen's Organic Chocolates | 48,996 | 973 |
| 17 | H | Hap's Go-Kart Track and Petting Zoo | 1108 | 87 |
| 18 | H | Hap's Go-Kart Track and Petting Zoo | 1872 | 116 |
You can also Download the example in CSV format
Filtering examples
The examples in this section illustrate how data set sizes are affected by filtering. Filtering is useful for several reasons:
- Filtering the data set reduces its size. A smaller data set is easier for a computer to process more quickly.
- Filtering the data set reduces the amount of irrelevant information humans have to deal with.
Example 1. Filter by a minimum of 9,000 impressions
In this example, we use a filter to see which of our line items has at least the minimum specified amount of reach. This reduces the size of the data set from 18 rows to 5.
| ID | Advertiser | Line Item | Impressions | Clicks |
|---|---|---|---|---|
| 3 | A | Bar-None Ice Cream Cones | 78231 | 1408 |
| 5 | B | Doggie Accessories | 9486 | 123 |
| 13 | F | Farmer Snowplows | 12448 | 256 |
| 14 | F | Farmer Snowplows | 23984 | 782 |
| 16 | G | Gretchen's Organic Chocolates | 48996 | 973 |
Example 2. Filter by two line items
In this example, we check the performance of two of our line items. This reduces our data set to 6 rows out of a possible 18.
| ID | Advertiser | Line Item | Impressions | Clicks |
|---|---|---|---|---|
| 1 | A | ACME Axe Co. | 1792 | 21 |
| 2 | A | ACME Axe Co. | 4355 | 34 |
| 9 | E | Best Soap & Candle | 3883 | 41 |
| 10 | E | Best Soap & Candle | 1292 | 183 |
| 11 | E | Best Soap & Candle | 902 | 81 |
| 12 | E | Best Soap & Candle | 5352 | 212 |
Example 3. Filter by advertisers B and D
In this example, we filter out all but two advertisers. This reduces our data set size from 18 row to 4 rows.
| ID | Advertiser | Line Item | Impressions | Clicks |
|---|---|---|---|---|
| 4 | B | Candles R-US | 2843 | 65 |
| 5 | B | Doggie Accessories | 9486 | 123 |
| 7 | D | Frog Hollow Athletic Socks | 8198 | 214 |
| 8 | D | Frog Hollow Athletic Socks | 103 | 12 |
Grouping and dimension selection guidance
Grouping can increase the size of the data set by adding rows (possibly a very large number of rows). Since the Microsoft Advertising reporting system automatically groups by all the dimensions you select, a best practice is to select as few dimensions as possible to get just the information you need. You can further reduce the effects of this automatic grouping of dimensions by applying filtering.