How to Debug Kernel Mode Blue Screen Crashes (for beginners)
Perhaps the largest call generator for the Core Team is for us to determine cause of a hard system crash that generates a Blue Screen and memory dump file. Commonly called a "Blue Screen of Death (BSOD)." The vast majority of these memory dumps could be analyzed by Administrators in just a few minutes using the latest debugging tools. These tools do most of the work for you, once they're set up. Kernel mode debugging is a pretty specialized skill, with experienced debuggers throwing around lots of imponderable terms. But it's really pretty simple and I'll point out the gaffe's you'll want to avoid as a beginner.
Keep in mind that the following is very basic (Debugging for Dummies, if you will). If you're already familiar with !analyze and how to get there, this article is not for you. Consider instead our sister website, NTDebugging (https://blogs.msdn.com/ntdebugging).
Here's some terminology you should know before carrying on:
Blue screen
When the system encounters a hardware problem, data inconsistency, or similar error, it may display a blue screen containing information that can be used to determine the cause of the error. This information includes the STOP code and whether a crash dump file was created. It may also include a list of loaded drivers and a stack trace.Crash dump file
You can configure the system to write information to a crash dump file on your hard disk whenever a STOP code is generated. The file (memory.dmp) contains information the debugger can use to analyze the error. This file can be as big as the physical memory contained in the computer. By default, it's located in the Windows folder, and you CAN call them "memory dumps" without fear of offending anyone.
Debugger
A program designed to help detect, locate, and correct errors in another program. It allows the user to step through the execution of the process and its threads, monitoring memory, variables, and other elements of process and thread context.Kernel mode
The processor mode in which system services and device drivers run. All interfaces and CPU instructions are available, and all memory is accessible.Minidump file
A minidump is a smaller version of a complete, or kernel memory dump. Usually Microsoft will want a kernel memory dump. But the debugger will analyze a mini-dump and quite possibly give information needed to resolve. If it's all you have, then debug it, rather than waiting for the machine to crash again. Open the file in the debugger (see below) just as opening memory.dmp in the demonstration.STOP code
The error code that identifies the error that stopped the system kernel from continuing to run. It is the first set of hexadecimal values displayed on the blue screen. At a minimum, frontline Admins should be required to note this code, and the four other codes displayed in parenthesis, and any drivers identified on the screen. Often, this is all you really need!Symbol files
All system applications, drivers, and DLLs are built such that their debugging information resides in separate files known as symbol files. Therefore, the system is smaller and faster, yet it can still be debugged if the symbol files are available. You don't need the Symbol files to debug - the debugger will automatically access the ones it needs from Microsoft's public site.
First, let's install the Debugger and Symbols. You can debug a 64 bit dump on a 32 bit system, and you can debug a 32 bit dump on an x64 machine. If you have an x64 machine then, you only need the x64 version to analyze any version of memory.dmp. Many engineers prefer to use just the 32 bit version, since you'll still see the information necessary to determine cause.
The sites below identify the system requirements, etc. you'll need for the debugger to work. For our purposes, we'll assume you have an actual memory dump (memory.dmp) file. If you don't the rest is not going to be much fun. You can access a memory dump over the network to a machine that's recently crashed. Most times though, it will make more sense to copy the dump file to your Debugging machine. Oh, and if you're wondering, you don't need a separate "Debugging machine" - the debugger doesn't use much memory and evil code from a memory dump can't sneak on to your machine and devour your movies and music.
For 32 bit, x86 debugging
https://www.microsoft.com/whdc/devtools/debugging/installx86.mspx#a
For 64 bit debugging
https://www.microsoft.com/whdc/devtools/debugging/install64bit.mspx#
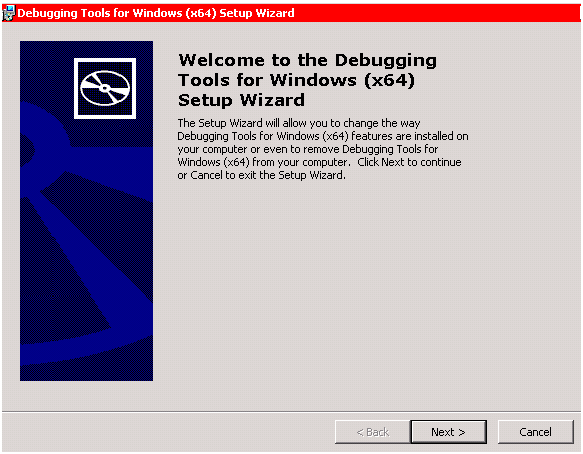
In this article I'll be using x64, but the examples will still apply to a 32 bit system. You'll need to download the debugger and install it - accept the defaults. 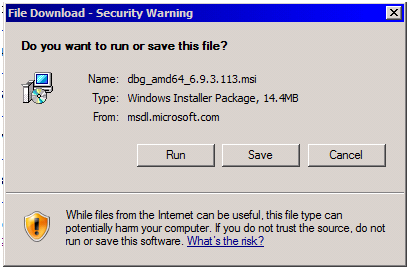
By default, everything you need (for now) is installed here.
C:Program FilesDebugging Tools for Windows (x64)
Note there's a help file (debugger.chm) that will be very useful as you advance your debugging skills. You start the debugger from /Start /Debugging Tools for Windows /WinDbg. This brings up the GUI mode of the Windows Debugger. There's also a command version that can be started using kd.exe. Unless you work at a driver developer, the GUI version is fine. If you do work at a driver developer, never open the GUI mode unless you're ready for sneers behind your back.
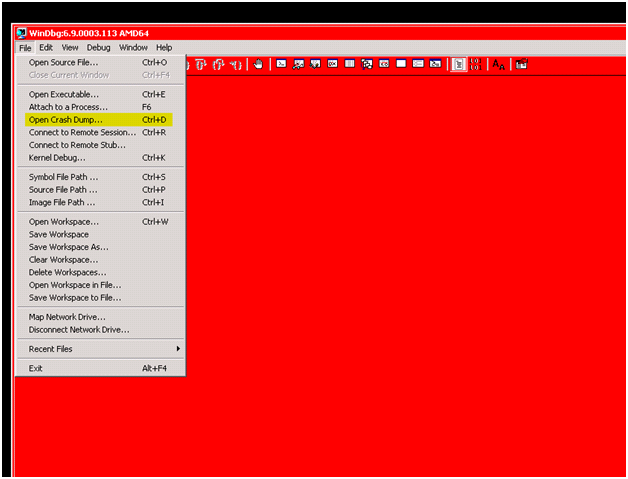
The debugger opens to a big red window with nothing in it. Assuming you have a memory.dmp file to be analyzed in your X:crashes folder, you'll want to go to /File /Open Crash Dump and browse there.
When you so open the memory.dmp, another window will be launched and you'll see output similar to below. Note the errors about Symbol files.
Loading Dump File [X:CrashesMEMORY.DMP]
Kernel Summary Dump File: Only kernel address space is availableSymbol search path is:
Executable search path is:
*** ERROR: Symbol file could not be found. Defaulted to export symbols for ntkrnlmp.exe -
Windows Server 2003 Kernel Version 3790 (Service Pack 2) MP (8 procs) Free x64
Product: Server, suite: TerminalServer SingleUserTS
Built by: 3790.srv03_sp2_gdr.080813-1204
Kernel base = 0xfffff800`01000000 PsLoadedModuleList = 0xfffff800`011d4140
Debug session time: Thu Oct 23 08:53:46.973 2008 (GMT-5)
System Uptime: 6 days 9:45:10.361
*** ERROR: Symbol file could not be found. Defaulted to export symbols for ntkrnlmp.exe -
Loading Kernel Symbols
..............................................................................................................................
Loading User Symbols
PEB is paged out (Peb.Ldr = 000007ff`fffde018). Type ".hh dbgerr001" for details
Loading unloaded module list
............................................
*******************************************************************************
* *
* Bugcheck Analysis *
* *
*******************************************************************************Use !analyze -v to get detailed debugging information.
BugCheck D1, {0, c, 0, 0}
*** ERROR: Module load completed but symbols could not be loaded for mssmbios.sys
***** Kernel symbols are WRONG. Please fix symbols to do analysis.*************************************************************************
*** ***
*** ***
*** Your debugger is not using the correct symbols ***
*** ***
*** In order for this command to work properly, your symbol path ***
*** must point to .pdb files that have full type information. ***
*** ***
*** Certain .pdb files (such as the public OS symbols) do not ***
*** contain the required information. Contact the group that ***
*** provided you with these symbols if you need this command to ***
*** work. ***
*** ***
*** Type referenced: nt!_KPRCB ***
*** ***
*************************************************************************
*** ERROR: Module load completed but symbols could not be loaded for CLASSPNP.SYS
Obviously, we have a Symbols problem! More importantly, this is our first experience of the debugger telling us what to do (or giving good hints). You'll want to watch for these clues as you progress in debugging. If you've heard people muttering about symbols and not being able to find the right ones, fear not! Go to the window at the bottom of the page and type !symfix. 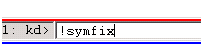
Most of the commands you'll use start with an exclamation point. But don't call it that! What you just typed is called "bang symfix." And what it does is connects the debugger to Microsoft's public symbols library on the internet. https://msdl.microsoft.com/download/symbols Note this isn't an ordinary web page, you can't access it through a browser. At this point, you'll need to save your workspace (give it a name in /File /Save Workspace). Close WinDbg and reopen it, your workspace, and your memory dump file.
This time, information will fly by and voila, you're debugging! What you'll see in the debugger window will vary by the kind of Stop Code being debugged. In this example, we're looking at a Stop 0x000000D1 (known to those in the know as a "Stop D1" - zeroes are ignored). You should see something like the following. If you get errors, or Symbols errors, for now, ignore them.
Microsoft (R) Windows Debugger Version 6.10.0002.229 AMD64
Copyright (c) Microsoft Corporation. All rights reserved.Loading Dump File [X:crashesMEMORY.DMP]
Kernel Summary Dump File: Only kernel address space is availableSymbol search path is: https://msdl.microsoft.com/download/symbols
Executable search path is: srv*
Windows Server 2003 Kernel Version 3790 (Service Pack 2) MP (8 procs) Free x64
Product: Server, suite: TerminalServer SingleUserTS
Built by: 3790.srv03_sp2_gdr.080813-1204
Machine Name:
Kernel base = 0xfffff800`01000000 PsLoadedModuleList = 0xfffff800`011d4140
Debug session time: Thu Oct 23 08:53:46.973 2008 (GMT-5)
System Uptime: 6 days 9:45:10.361
Loading Kernel Symbols
...............................................................
...............................................................
Loading User Symbols
PEB is paged out (Peb.Ldr = 000007ff`fffde018). Type ".hh dbgerr001" for details
Loading unloaded module list
............................................
*******************************************************************************
* *
* Bugcheck Analysis *
* *
*******************************************************************************Use !analyze -v to get detailed debugging information.
BugCheck D1, {0, c, 0, 0}
Debugger CompCtrlDb Connection::Open failed 80004005
PEB is paged out (Peb.Ldr = 000007ff`fffde018). Type ".hh dbgerr001" for details
PEB is paged out (Peb.Ldr = 000007ff`fffde018). Type ".hh dbgerr001" for details
Probably caused by : HpCISSs2.sysFollowup: wintriag
---------
At this point the debugger might give us a clue to what likely caused the problem, with the statement (which may not be present in your analysis),
Probably caused by :
Then the problem file will be identified. Nearly all bugchecks are caused by an incorrect driver (most manufacturers are pretty good about fixing flaws in their drivers). You can fix this (again in most cases) by just obtaining the latest version of that driver (and related installation software) from the vendor.
If the debugger doesn't give this clue, or you're suspicious it's incorrect, the debugger tells you what to do..
Use !analyze -v to get detailed debugging information.
In fact, you don't even have to type, just click on the !analyze -v with your mouse, and you're off and running again. The debugger gives even more detailed information and a message of what to do next...
7: kd> !analyze -v
*******************************************************************************
* *
* Bugcheck Analysis *
* *
*******************************************************************************DRIVER_IRQL_NOT_LESS_OR_EQUAL (d1)
An attempt was made to access a pageable (or completely invalid) address at an
interrupt request level (IRQL) that is too high. This is usually
caused by drivers using improper addresses.
If kernel debugger is available get stack backtrace.
Arguments:
Arg1: 0000000000000000, memory referenced
Arg2: 000000000000000c, IRQL
Arg3: 0000000000000000, value 0 = read operation, 1 = write operation
Arg4: 0000000000000000, address which referenced memoryDebugging Details:
------------------PEB is paged out (Peb.Ldr = 000007ff`fffde018). Type ".hh dbgerr001" for details
PEB is paged out (Peb.Ldr = 000007ff`fffde018). Type ".hh dbgerr001" for detailsREAD_ADDRESS: 0000000000000000
CURRENT_IRQL: c
FAULTING_IP:
+0
00000000`00000000 ?? ???PROCESS_NAME: vssrvc.exe
DEFAULT_BUCKET_ID: DRIVER_FAULT
BUGCHECK_STR: 0xD1
TRAP_FRAME: fffffadf238fc110 -- (.trap 0xfffffadf238fc110)
NOTE: The trap frame does not contain all registers.
Some register values may be zeroed or incorrect.
rax=00000000fff92000 rbx=0000000000000000 rcx=00000000c0000102
rdx=00000000000007ff rsi=0000000000000000 rdi=fffff80001031095
rip=0000000000000000 rsp=fffffadf238fc2a0 rbp=0000000000000007
r8=0004969a8262692a r9=fffff800011b73e8 r10=0000000000000000
r11=fffffadf29aed450 r12=0000000000000000 r13=0000000000000000
r14=0000000000000000 r15=0000000000000000
iopl=0 nv up ei ng nz na pe nc
00000000`00000000 ?? ???
Resetting default scopeLAST_CONTROL_TRANSFER: from fffff8000102e5b4 to fffff8000102e890
FAILED_INSTRUCTION_ADDRESS:
+0
00000000`00000000 ?? ???STACK_TEXT:
fffffadf`238fbf88 fffff800`0102e5b4 : 00000000`0000000a 00000000`00000000 00000000`0000000c 00000000`00000000 : nt!KeBugCheckEx [d:ntbasentoskeamd64procstat.asm @ 170]
fffffadf`238fbf90 fffff800`0102d547 : fffffadf`35519260 00000000`00008000 00000000`00000100 fffffadf`292ca8cf : nt!KiBugCheckDispatch+0x74 [d:ntbasentoskeamd64trap.asm @ 2122]
fffffadf`238fc110 00000000`00000000 : 00000000`00000000 00000000`00000000 00000000`00000000 00000000`00000000 : nt!KiPageFault+0x207 [d:ntbasentoskeamd64trap.asm @ 1006]STACK_COMMAND: kb
MODULE_NAME: HpCISSs2
IMAGE_NAME: HpCISSs2.sys
DEBUG_FLR_IMAGE_TIMESTAMP: 4600a3fe
POOL_CORRUPTOR: HpCISSs2
FOLLOWUP_NAME: wintriag
FAILURE_BUCKET_ID: X64_POOL_CORRUPTION_HpCISSs2
BUCKET_ID: X64_POOL_CORRUPTION_HpCISSs2
OCA_CRASHES: 854 (in last 90 days)
Followup: wintriag
---------
The Debugger again tells you what to do (just click on HpCISSs2 to get details on the driver you should update and the timestamp (highlighted below).
7: kd> lmvm HpCISSs2
start end module name
fffffadf`296f3000 fffffadf`29705000 HpCISSs2 (deferred)
Image path: HpCISSs2.sys
Image name: HpCISSs2.sys
Timestamp: Tue Mar 20 22:18:22 2007 (4600A3FE)
CheckSum: 00015F1F
ImageSize: 00012000
Translations: 0000.04b0 0000.04e4 0409.04b0 0409.04e4
Comments
Anonymous
January 01, 2003
@Satya
You can always boot into Safe Mode, Safe Mode with Networking, or Safe Mode Command prompt. In Safe Mode (any of the three), you can always boot it with a USB drive plugged in and assign it a drive letter so you can copy the dump off with.Anonymous
January 01, 2003
Thanks tomac. 5 start to ya. JHAnonymous
January 01, 2003
Very useful article.Anonymous
January 01, 2003
The comment has been removedAnonymous
January 01, 2003
Thanks tomac. 5 STARS to ya. JHAnonymous
January 01, 2003
I need help with my lappy crashing and getting blue screen errors.. i dn't knw anything about this debugging stuff or what or how to fix it.. System - Provider [ Name] Microsoft-Windows-Kernel-Power [ Guid] {331C3B3A-2005-44C2-AC5E-77220C37D6B4} EventID 41 Version 2 Level 1 Task 63 Opcode 0 Keywords 0x8000000000000002 - TimeCreated [ SystemTime] 2012-05-01T00:14:34.456014000Z EventRecordID 6390 Correlation - Execution [ ProcessID] 4 [ ThreadID] 8 Channel System Computer tracij - Security [ UserID] S-1-5-18EventData BugcheckCode 26 BugcheckParameter1 0x41284 BugcheckParameter2 0x186b1001 BugcheckParameter3 0x12df7 BugcheckParameter4 0xfffff70001080000 SleepInProgress false PowerButtonTimestamp 0^^^IS WHAT HAS BEEN GOING ONAnonymous
January 01, 2003
PingBack from http://mstechnews.info/2008/10/how-to-debug-kernel-mode-blue-screen-crashes-for-beginners/Anonymous
July 22, 2010
I experienced numerous crashes since I built my system. What I found out was I had not connected the correct power supply to the motherboard. It was running on half power. Once I corrected this my system has not crashed in 3 days. I was able to overclock my graphics card without any failures. So my suggestion would be make sure you have an adequate power supply. I don't know how to do this so check with the forums.Anonymous
August 01, 2010
fantastic i dont know anything about computers but this will help me a great deal thanksAnonymous
September 13, 2010
what do i do if it doesn't find anything when i search for memory.dmp?Anonymous
March 23, 2011
Superrrr.. very informative for startersAnonymous
June 22, 2011
Great Blog but...what happens if this happens ( sry for english, I#ve learned it 30 years ago^^)System - Provider [ Name] Microsoft-Windows-Kernel-Power [ Guid] {331C3B3A-2005-44C2-AC5E-77220C37D6B4} EventID 1 Version 2 Level 1 Task 63 Opcode 0 Keywords 0x8000000000000002 - TimeCreated [ SystemTime] 2011-06-22T09:39:55.664824700Z EventRecordID 131324 Correlation - Execution [ ProcessID] 4 [ ThreadID] 8 Channel System Computer Multi-Core-PC - Security [ UserID] S-1-5-18EventData BugcheckCode 0 BugcheckParameter1 0x0 BugcheckParameter2 0x0 BugcheckParameter3 0x0 BugcheckParameter4 0x0 SleepInProgress false PowerButtonTimestamp 0Anonymous
January 23, 2012
Tom, Thanks for taking the time to attack the bsod issue that is treated like sorcery. Thanks for sharing your knowledge with non-expert geeks.Anonymous
August 11, 2012
This needs to be completely updated to today's reality, none of the important links are relevant [ie. redirected to items that relate to the idea but not the desired information or just blank pages with no redirect] and none of the screen views or said directions seem to be relevant either! Please re-write this so some smuck like me can learn how to debug a kernel error please....... without needing 2G of programs!!!!!!!!!!!!!!!!!!!! Or is that just out side the current reality?Anonymous
January 08, 2013
This really helped me resolve my BSOD issue! Thanks for keeping it simple.Anonymous
April 04, 2013
The comment has been removedAnonymous
July 24, 2013
ripostate i link per scaricare i programmi per windows 7 trovo solo per windows 8Anonymous
October 06, 2013
Awesome write up. Thank!Anonymous
December 17, 2013
Pingback from Server Unexpected Shutdown/BSOD/Dump file analysis | rkpulagouniAnonymous
April 25, 2014
very nice guide, thanks.Anonymous
April 25, 2014
very nice guide, thanks.Anonymous
June 11, 2014
I am a Novice and find this article excellent and easy to follow. I just completed my first debbuging using Win 7!!!Anonymous
June 14, 2014
Pretty straight forward procedure and now BSODs can speak my language :-)Anonymous
September 04, 2014
Hi ms Team just wanted to know I have one physical server in different location ,since I don't have management console ,how do I check the dump file since the server itself is throwing BSOD and I am not able to open the server,here how do I check the BSOD ?
pls help urgentely !Anonymous
January 26, 2015
Thank you so much, very helpful, nice work! :)Anonymous
June 11, 2015
Still works for Hyper-V 2012 R2.
Thanks for the info.Anonymous
July 25, 2015
So how we gonna instill the software if the windows crash ? and we don't have the option for the save mode ?Anonymous
October 03, 2015
Hey, I'm trying to locate the memory.dmp file, does anyone know how to create/locate it.Anonymous
November 23, 2015
The system has rebooted without cleanly shutting down first. This error could be caused if the system stopped responding, crashed, or lost power unexpectedly.Anonymous
December 27, 2016
The comment has been removedAnonymous
December 14, 2017
The comment has been removed