Physical memory overwhelmed PAL analysis - holy grail found!
I just wrote a very complicated PAL analysis that determines if physical memory is overwhelmed. This analysis takes into consideration the amount of available physical memory and the disk queue length, IO size, and response times of the logical disks hosting the paging files.
Also, if no paging files are configured, then it simply has a warning (1) for less than 10% available physical memory and critical (2) for less than 5% available physical memory.
This analysis (once tested) will be in PAL v2.3.6.
I am making an effort to make this analysis as perfect as I can, so I am open to discussion on this. For example, I might add in if pages/sec is greater than 1 MB, but we have to assume that the disks hosting the paging files are likely servicing non-paging related IO as well. I’m just trying to make it identify that there is *some* paging going on that may or may not be related to the paging files. Also, I am considering adding an increasing trend analysis to this analysis for \Paging File(*)\% Usage, but catching it increasing for a relatively short amount of time is difficult.
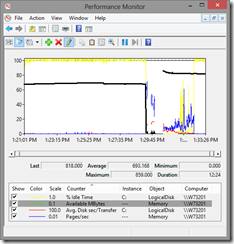
Here is a screenshot of Perfmon with the counters that PAL is analyzing:
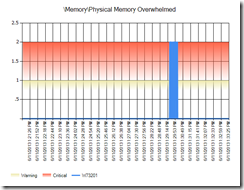
Here is PAL’s simplified analysis…
Memory Physical Memory Overwhelmed
Description: It's complicated.
The physical memory overwhelmed analysis explained…
When the system is low on available physical memory (available refers to the amount of physical memory that can be reused without incurring disk IO), the system will write modified pages (modified pages contain data that is not backed by disk) to disk. The rate at which it writes depends on the pressure on physical memory and the performance of the disk drives.
To determine if a system is incurring system-wide delays due to a low physical memory condition:
- Is \Memory\Available MBytes less than 5% of physical memory? A “yes” does not indicate system-wide delays. If yes, then go to the next step.
- Identify the logical disks hosting paging files by looking at the counter instances of \Paging File(*)\% Usage. Is the usage of paging files increasing? If yes, go to the next step.
- Is there significant hard page faults using \Memory\Pages/sec? Hard page faults might or might not be related to paging files, so this counter alone is not an indicator of a memory problem. A page is 4 KB in size on x86 and x64 Windows and Windows Server, so 1000 hard page faults is 4 MB per second. Most disk drives can handle about 10 MB per second, but we can’t assume that paging is the only consumer of disk IO.
- Are the logical disks hosting the paging files overwhelmed? If the logical disk constantly has outstanding IO requests determined by \LogicalDisk(*)\% Idle Time of less than 10 and if the response time are greater than 15 ms (measured by \LogicalDisk(*)\Avg. Disk sec/Transfer) and if the IO sizes are greater than 64 KB (measured by \LogicalDisk(*)\Avg. Disk Bytes/Transfer), then add 10 ms to the response time threshold.
- As a supplemental indicator, if \Process(_Total)\Working Set is going down in size, then it might indicate that global working set trims are occurring.
- If all of the above is true, then the system’s physical memory is overwhelmed.
I know this is complicated and this is why I created the analysis in PAL (https://pal.codeplex.com) called \Memory\Physical Memory Overwhelmed that takes all of this into consideration and turns it into a simply red, yellow, or green indicator.
Comments
Anonymous
January 01, 2003
Hi Jim, Great comment and question. I like your page inputs compared to disk reads approach, but a page input could be from any disk where disk reads is per disk. Also, the disk reads doesn't differentiate what is from page fault demands versus a standard file read. My understanding is that Demand Zero Faults/sec measures the number of zero pages needed for working sets. Zero pages come from the Zero page list. The Free page list and the Zero page list make up the "Free" memory of the system. Available memory is made up of the Zero, Free, and Standby page lists and low available is the most important indicator of a lack of physical memory indicator. So, Demand Zero Faults/sec is only measuring 1 of 3 resources used for providing physical memory pages to active working sets. So, I would use Demand Zero Faults/sec as supplementary evidence - not as a primary indicator. I use disk latency as a way to determine if the disk is overwhelmed by comparing the average response times to the service times of the disk. It's not the queue length that is important, but how fast the IO request packets are fulfilled. I would love to continue this coversation over public forums like this. Please keep this kind of feedback coming!Anonymous
June 13, 2013
The comment has been removedAnonymous
November 02, 2013
Hi Clint, I really appreciate the effort you have put into PAL. I look at a lot of SQL servers and maybe you don't intend this memory assessment to be used on databases. Many of the servers I review are SAN connected. As such, the partitions may actually be SAN LUN's which generally have cache so writes are acknowledged in a few milliseconds (generally less than 5ms and on average 0-1ms on healthy systems). I suspect your logic could be derailed by that condition (or even local disk with onboard cache). So I think you could still have memory overload and have it masked by low latency. Any servers that boot from SAN could have that potential too (even if they aren't DB servers). I think there may be another way of capturing an increase in memory pressure and it too, is complicated. I don't know if it engineerable (if that's a word) in PAL. If you know, "a page is 4 KB in size . . ., so 1000 hard page faults is 4 MB per second. Most disk drives can handle about 10 MB per second, but we can’t assume that paging is the only consumer of disk IO." Can you do the following extract for a specific set of intervals (say interval 1 to 50) and then do the same calculation for a suspect period (interval 120-135 for example): Look at total bytes to the logical disk paging file location and subtract (Memory pages /secs x4MB) = percentage of paging Interval sample A might be 20% but interval sample B might be 70% and a jump of more than X% would be your warning/critical mark. Or, can you create a moving average (like tracking a stock price) over the last 20 intervals (or some meaningful range) that would highlight a spike in the memory pressure? Thanks - JimAnonymous
December 13, 2013
The comment has been removedAnonymous
March 07, 2014
A nice tool to work with and make the things very much simple. I have a server with 512 GB RAM with SQL Server installed on it with 400 GB RAM allocated to it. I have observed the processor utilization max to 15% and memory up to 350 GB utilized. When I am putting this Pefmon data in PAL. I have observed that the Memory Physical Memory Overwhelmed is always in red with criticality 2. I Have gathered the data twice in the month but result is same. I also disabled the Page file as its not recommended for the Server having so huge RAM. Kindly help me with the recommendations or should I avoid this finding?
Any help will be really appreciated..

