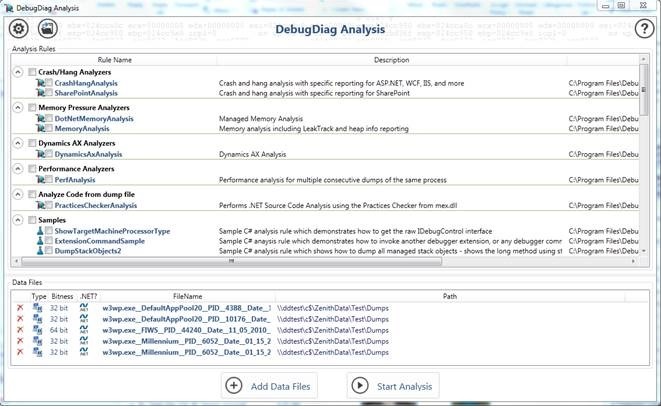
DebugDiag 2.0 is now RTW

The DebugDiag development team is very excited to announce the general availability of DebugDiag 2.0. The long waited DebugDiag 2.0 comes now with the new analysis engine fully converted to .NET to allow for faster analysis rule development. The tool comes also with a number of new features in the Collection and Analysis modules such as .NET 4.5 support, CLRMD integration, C# and XAML sample rules, Detailed 1st chance exception logging …etc.
Download the tool from debugdiag.com
(it should redirect here)
Thank you
Comments
Anonymous
October 03, 2013
Why does almost every microsoft post start with "I'm very excited"Anonymous
October 03, 2013
@KarstenFK because making software is very exciting! :)Anonymous
October 14, 2013
I'm excited =)Anonymous
October 15, 2013
Rats, I was hoping that this version would fix the problem with not calculating heap fragmentation when the O/S is Vista or newer. Any sort of calculation would be more useful than just printing "Unavailable"... I guess I won't be upgrading soon. At least with 1.2, I could fix the HeapFunctions.asp script myself, with the new version I can't even do that.Anonymous
October 27, 2013
the analysis module is not available for install on windows 2003 server although i have .net 4 installed there. is this the intended behavior or a bug?Anonymous
October 29, 2013
@Dani - it's intended behavior. Analysis on Windows Server 2003 is not supported. As a workaround, instead of using the .msi you can xcopy the DebugDiag directory from another machine and run register.bat. Be sure the other machine is post-2003, and matches the bitness (32, 64) of your 2003 machine.Anonymous
November 13, 2013
Finally, it can be installed on Russian Windows without problems! Thanks guys!Anonymous
November 19, 2013
Dang, DebugDiag 2.0 Analysis throws exceptions or crashes when trying to analyze a Memory.dmp. CrashHangAnalysis Fails with this message: Dump File: D:DatenMEMORY.DMP; Type: System.Runtime.InteropServices.SEHException Message: Eine externe Komponente hat eine Ausnahme ausgelöst. Stack Trace: bei CrashHangExtLib.IUtils.get_IsTEBValid(UInt32 ThreadSysID) bei DebugDiag.AnalysisRules.CacheFunctions.ScriptThreadClass.get_HasValidTeb() bei DebugDiag.AnalysisRules.AnalyzeThreads.getOKUnresolvedAndBadTebAnalysis(ScriptThreadClass Thread, AnalyzedThreadClass AnalyzedThread) bei DebugDiag.AnalysisRules.AnalyzeThreads.getAnalysis(ScriptThreadClass Thread) bei DebugDiag.AnalysisRules.AnalyzeThreads.DoAnalyzeThreads() bei DebugDiag.AnalysisRules.CrashHangAnalysis.DoHangAnalysis() bei DebugDiag.AnalysisRules.CrashHangAnalysis.RunAnalysisRule(NetScriptManager manager, NetProgress progress) bei DebugDiag.DotNet.NetAnalyzer.RunAnalysisRulesInternal(DumpFileType bitness, NetProgress progress, String symbolPath, String imagePath, String reportFileFullPath, Boolean twoTabs, AnalysisModes analysisMode) Running MemoryAnalysis DD even crashes with an EventId 1000, Source: Application Error. Is there an update available? sam at B-soft dot deAnonymous
November 20, 2013
Is there anyway to customize the debugdiagnostics tool to dump only when there is enough hard disk space. I am also planning to dump only for first 10 crashes on that day. To do this, I am studying vbs scripts under scripts to add my customization to define an API (GetDiskFreeSpaceEx), I am keep getting error, as the tool don't compile and use itself. Does anyone know any variable which tracks the disk size.Anonymous
November 21, 2013
Looks like you guys are in such a hurry that you didn't changed the copyright year on the About Dialog. Just want to let you know.Anonymous
November 22, 2013
@Chandra(Myself) I have customized the tool with what I wanted from the above post. If anyone looking for it, let me know. I am happy to help you.Anonymous
December 04, 2013
Where can i report bugs with this product?Anonymous
December 04, 2013
Attempting a crash analysis using DebugDiag v2, with logs generated by Debug Diag v1.2 I get this exception being thrown when I attempt to analyze the log. CrashHangAnalysis Failed Dump File: xxxxxxxx__PID__10412__Date__12_04_2013__Time_06_54_09PM__469__Second_Chance_Exception_C0000005.dmp; Type: System.OverflowException Message: Value was either too large or too small for an Int32. Stack Trace: System.Convert.ToInt32(Double value) DebugDiag.AnalysisRules.AnalyzeCritSecsImpl.IsThreadBlockedByCritSec_Recurse(ScriptThreadClass Thread, IDbgCritSec CritSec) DebugDiag.AnalysisRules.AnalyzeCritSecsImpl.AnalyzeCritSec(IDbgCritSec CritSec) DebugDiag.AnalysisRules.AnalyzeCritSecsImpl.AnalyzeCritSecs() DebugDiag.AnalysisRules.CrashHangAnalysis.DoHangAnalysis() DebugDiag.AnalysisRules.CrashHangAnalysis.RunAnalysisRule(NetScriptManager manager, NetProgress progress) DebugDiag.DotNet.NetAnalyzer.RunAnalysisRulesInternal(DumpFileType bitness, NetProgress progress, String symbolPath, String imagePath, String reportFileFullPath, Boolean twoTabs, AnalysisModes analysisMode)Anonymous
December 05, 2013
The comment has been removedAnonymous
January 19, 2014
Hi there, I'm using DebugDiag 2.0, version: 2.0.0.179. Same as reported from "Report", I'm facing this exception which fails MemoryAnalysis: Type: System.OverflowException Message: Value was either too large or too small for an Int32. PerfAnalysis is failed due to this exception: Type: System.NullReferenceException Message: Der Objektverweis wurde nicht auf eine Objektinstanz festgelegt. Stack Trace: bei DebugDiag.AnalysisRules.CDumps.DoVersionsMatch(String& v1, String& v2) bei DebugDiag.AnalysisRules.CDumps.SomeDotNetImageFilesAreMissingOrMismatched(NetDbgObj debugger) bei DebugDiag.AnalysisRules.CDumps.SaveModulesAndAppendExePaths() bei DebugDiag.AnalysisRules.PerfAnalysis.VerifyAndSortDumps() bei DebugDiag.AnalysisRules.PerfAnalysis.RunAnalysisRule(NetScriptManager manager, NetProgress progress) bei DebugDiag.DotNet.NetAnalyzer.RunAnalysisRulesInternal(DumpFileType bitness, NetProgress progress, String symbolPath, String imagePath, String reportFileFullPath, Boolean twoTabs, AnalysisModes analysisMode) Is there any update which fixes these problems?Anonymous
February 13, 2014
Where can we report bugs that we have found using the tool???Anonymous
February 13, 2014
The comment has been removedAnonymous
May 15, 2014
i am so sorry as I was not following the blog too closely. please for any bugs, send us emails at dbgdiag at Microsoft dot comAnonymous
October 22, 2014
FYI, the issue an exception in get_IsTEBValid for MEMORY.DMP is most likely because memory.dmp is a kernel dump. The current version of DebugDiag only supports usermode dumps.