UAG DirectAccess monitoring and troubleshooting in UAG 2010 SP1
After deploying your UAG DirectAccess environment, you need to ascertain that it’s up and running, and is providing the remote access as planned. There are a few things you’ll want to check:
- Are all the relevant services up and running? Were there any failures?
- Are there users currently connected to the system? Are they hitting any errors?
- A user reports that he or she had trouble connecting yesterday evening – how can you know what happened?
Fortunately, the new DirectAccess logging and monitoring functionality provides answers to these questions. Starting from SP1, UAG supports out-of-the-box logging and monitoring functionality for DirectAccess user activity, based on the TMG SQL logging infrastructure.
What’s new in UAG DirectAccess logging & monitoring?
In SP1, we augmented the existing UAG monitoring tool (Web Monitor), with real-time DirectAccess monitoring information. Two new screens were added: DirectAccess Monitor – Current Status, and DirectAccess Monitor – Active Sessions.
DirectAccess Current Status screen displays a “SCOM-like” health indication of UAG DirectAccess servers and relevant DirectAccess sub-components. On this screen, you can see whether the UAG DirectAccess servers in your deployment are configured for DirectAccess, and that all relevant sub-components (DNS64, IP-HTTPS, etc.) are up and running. Everything is presented at the array level so that the admin can access all the information from the console of any array node.
Figure 1: DirectAccess server health status screen
DirectAccess Active sessions screen presents the list of DirectAccess sessions currently connected via all UAG DirectAccess array nodes. You can see a list of currently logged on users, access level (infrastructure or intranet), NAP health status, machine account, user account, and other fields.
Figure 2: DirectAccess active sessions
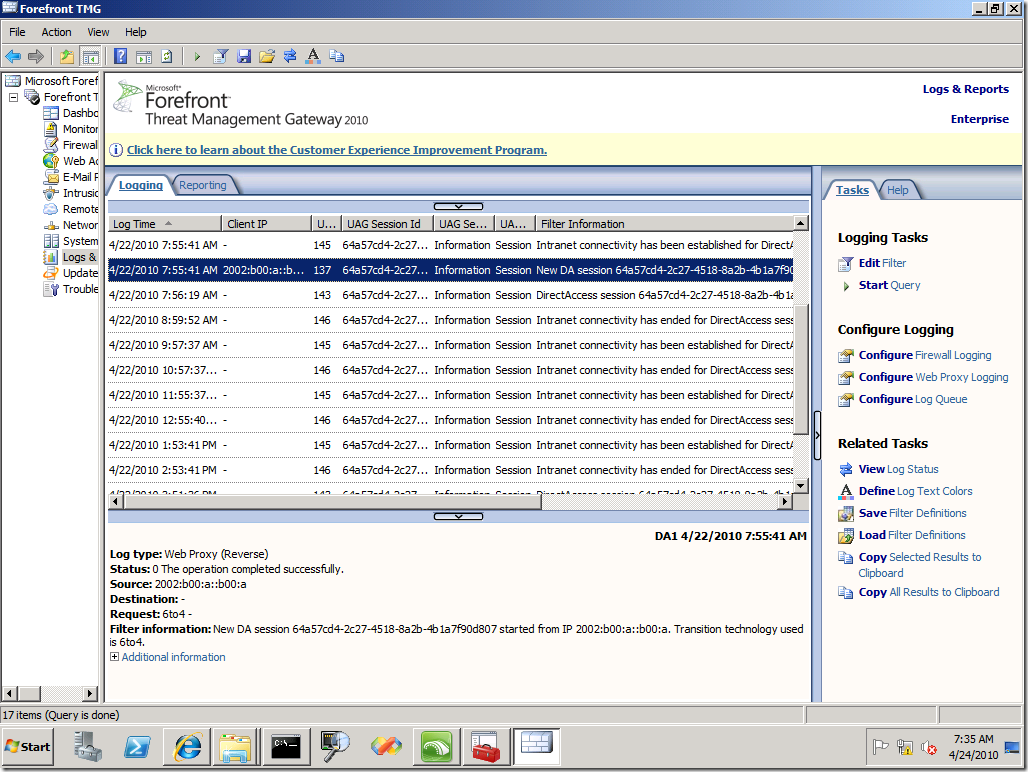
Web Monitor is useful for monitoring the current state of your DirectAccess deployment. In order to search across DirectAccess sessions that occurred in the past, you can use either the user monitoring PowerShell snap-in or the TMG SQL log viewer. The user monitoring PowerShell snap-in now presents the user and server monitoring information at the array-level, without enabling the Security Auditing event logs.
Figure 3: TMG log viewer displaying DirectAccess events
How does it work?
At the beginning of a DirectAccess session, the DirectAccess client and UAG DirectAccess server establish security associations (SAs). This is a security agreement with which both computers agree on how to exchange and protect information transferred during the DirectAccess session. You can see the configured and currently opened SAs on the “Windows Firewall with Advanced Security” screen.
The UAG DirectAccess logging mechanism monitors the currently opened SAs, and uses the SA info to log and monitor DirectAccess user activity. Changes in session state are written to the SQL log for persistency. Errors encountered during the session (e.g., “a smartcard wasn’t provided”) are also monitored and written to the SQL log. In this way the logging mechanism collects and stores information about DirectAccess sessions that can be subsequently viewed on the Web Monitor DirectAccess Active Sessions screen, or via the PowerShell snap-in or TMG log viewer.
What else?
What happened to DirectAccess user monitoring mechanism supported in earlier UAG releases? What is the difference between the new mechanism and the old one?
The DirectAccess user monitoring mechanism supported in Forefront UAG 2010 RTM (TechNet article here) was based on IPSec logging messages printed to the Security event log. The new SP1 implementation doesn’t require IPSec logging to be enabled, but rather collects the required SA information programmatically. The PowerShell snap-in was re-designed to work over the new infrastructure for both current and historic sessions. The snap-in was also augmented to include server health info.
How do I enable the new DirectAccess logging and monitoring feature?
DirectAccess logging and monitoring functionality is on by default. It collects DirectAccess events from the moment DirectAccess is configured and running on a UAG SP1 machine. Note that SQL logging is mandatory for DirectAccess monitoring functionality, so make sure it’s not disabled on your system.
Where can I find more info on this feature?
See https://technet.microsoft.com/en-us/library/gg313780.aspx for more info on UAG DirectAccess logging and monitoring, including information on the different PowerShell snap-in parameters.
We appreciate your feedback: please post comments for any questions you have, or for issues you might encounter with the new DirectAccess monitoring mechanism.


