Start Debugging with Windbg
Hey folks, I’m a big fan of Windbg. It’s really powerful and you can do much more things than you can do with another other debugger!
In this blog post I’m going to show you different methods to start debugging with windbg.
Start by launching the process with Windbg
This is easy. If you need to debug a simple application and you have the exe path, you can launch it with Windbg either from the command line or from the UI. All you need to do is launching Windbg and clicking “Open Executable” menu item from the File menu. You can then provide executable path and arguments to the process. Once you click Open, your debugging session starts.
Start by attaching the process to Windbg
If you have a process that’s already running, you can use this option to start debugging with Windbg. This option is useful when debugging services or processes that cannot be restarted. To do so, launch the Windbg and select “Attach to a Process” menu item from the File menu. Windbg will display a list of processes that you can select any to attach it to the debugger. Once you click OK, your debugging session starts.
Start by using Gflags
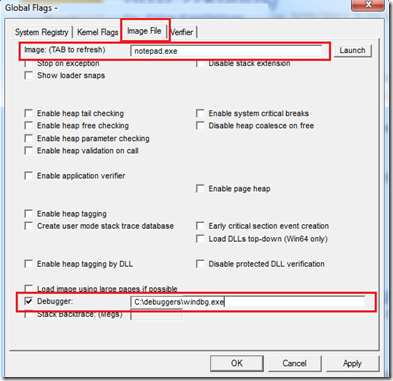
This is a little bit advanced. You can use gflags.exe, a utility tool for processes, to start the process under Windbg. Here is how it works: You write the executable name to the GFLAGS under Image File tab and it displays you a bunch of options. In the below image, I launched the gflags.exe as administrator, switched to Image File tab and wrote notepad.exe as image name. When I clicked the TAB key, it displayed options associated with the notepad executable. The Debugger option should be filled to point to Windbg.exe path in your system.
Now, whenever notepad.exe launches in the system, it will be started as attached to Windbg. GFLAGS is very useful when you are debugging a process and when you don’t know when it will be started or by whom it will be started.
Start by child debugging
Windbg has a command to enable child debugging for any process. All you need to do is to write below command to the Windbg command line in parent process’ debugging session:
.childdbg 1
So, where can you use this method? Let’s assume that you are going to debug a service process running as SYSTEM. Normally, you can use the attach the process to Windbg method after service starts. However, what if you want to debug the service start up? In this case you can’t use the attach method because you would miss the service startup. You can’t use GFLAGS either because the service is running as SYSTEM and Windbg will start in another desktop (SYSTEM user’s desktop) and won’t be available to you.
So, here is what you can do:
- Attach the services.exe to Windbg by using attach to a process method.
- Run “.childdbg 1” command in the Windbg command window. This will enable the child debugging for services.exe
- Start the service you want to debug. What will happen is that new service will start and the Windbg console that’s attached to the services.exe process will break, indicating that a new process is started. Now you will have the ability to debug the new process in the same Windbg program.
Start by setting the Windbg as default postmortem debugger
You can run “Windbg –I” command from a command line tool to set your Windbg as default postmortem debugger. This is useful when running application verifier to verify your process. In case of any appverifier stop, Windbg will be automatically launched and attached to the process.
Start by setting MsiBreak environment variable
Have you ever needed to debug a custom action in your installer? Windows Installer uses MsiBreak environment variable to give you a chance to debug your custom action. Basically, you need to create an environment variable named MsiBreak and set its value to the custom action name. When the custom action is being executed during the install time, you will be asked to attach the process to the debugger. You can use attaching process to Windbg method to start debugging your custom action.
In this post, I tried to cover different methods to start debugging a process in user mode. If you haven’t tried Windbg already, I strongly recommend to start using it!
Comments
- Anonymous
June 19, 2013
This is nice. Never thought this way. But when I am trying to attach windbg to services.exe, it actually does not attach properly, it gets stuck on "Debuggee not connected". Is it something related to win8 that we cannot attach to services.exe?
