Defenders think in lists. Attackers think in graphs. As long as this is true, attackers win.
Defender Mindset
A lot of network defense goes wrong before any contact with an adversary, starting with how defenders conceive of the battlefield. Most defenders focus on protecting their assets, prioritizing them, and sorting them by workload and business function. Defenders are awash in lists of assets—in system management services, in asset inventory databases, in BCDR spreadsheets. There's one problem with all of this. Defenders don't have a list of assets—they have a graph. Assets are connected to each other by security relationships. Attackers breach a network by landing somewhere in the graph using a technique such as spearphishing and they hack, finding vulnerable systems by navigating the graph. Who creates this graph? You do.
What Is the Graph?
The graph in your network is the set of security dependencies that create equivalence classes among your assets. The design of your network, the management of your network, the software and services used on your network, and the behavior of users on your network all influence this graph. Take a domain controller for example. Bob admins the DC from a workstation. If that workstation is not protected as much as the domain controller, the DC can be compromised. Any other account that is an admin on Bob's workstation can compromise Bob and the DC. Every one of those admins logs on to one or more other machines in the natural course of business. If attackers compromise any of them, they have a path to compromise the DC.
Six Degrees of Mallory
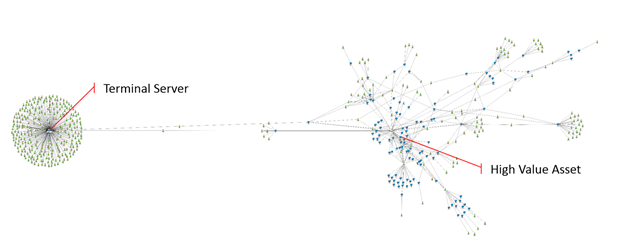
Attackers can lay in wait on a compromised machine, using a password dumper such as mimikatz until a high value account logs on to the machine. Let's examine an example graph.

Figure 1 Example network logon graph
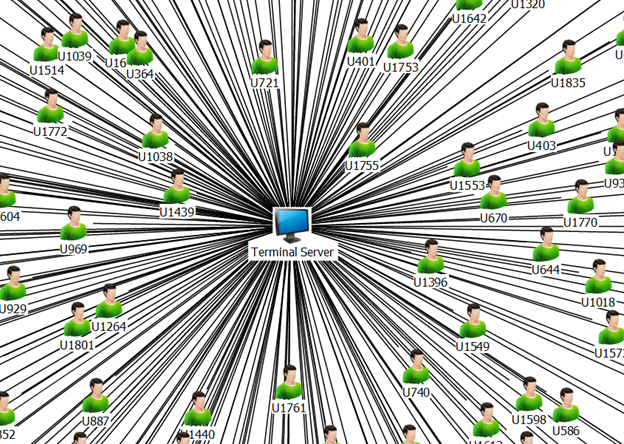
The cluster on the left is single Terminal Server used by hundreds of users. If attackers compromise this machine, they can dump the credentials of many users over time.

Figure 2 A compomised terminal server can lead to many credentials
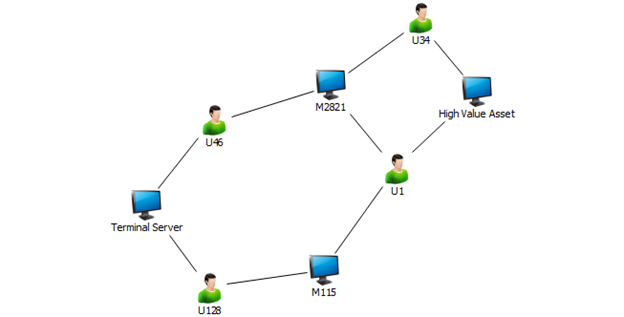
How can attackers move laterally to get to the High Value Asset?

Figure 3 An attack path exists from compromising a terminal server to a high value asset
By searching the graph, attackers discover multiple paths to the High Value Asset. Compromising the terminal server can allow attackers to also compromise User46 and User128. Those users are admins on Machine2821 and Machine115 respectively. Compromising those workstations allows attackers to compromise User1 and User34, both of which are admins on the High Value Asset. For the High Value Asset to be protected, all the dependent elements must be as protected as thoroughly as the HVA—forming an equivalence class.
Security Dependencies
In a Windows network, when users perform certain kinds of logons (Interactive, Terminal Server, and others), those users' credentials (and single-sign-on equivalents such as a Kerberos TGT or NTLM hash) are exposed to theft if the underlying host is compromised. Beyond this, there are many kinds of relationships that create security dependencies:
- Local admin accounts with a common password. Compromise one system, dump the local admin password, and use that password on other hosts with the same password.
- File servers housing logon scripts that run for many users and software update servers.
- Print servers that deliver print drivers to client machines when used.
- Certificate authorities that issue certificates valid for smart card logons.
- Database admins that can run code under the context of a database server running as a privileged user.
And so on. There are indirect relations as well. A machine that has a vulnerability can be compromised, suddenly allowing attackers to create new edges in the graph. Or users may have an account in two untrusted domains with the same password, creating a hidden edge between domains.
Manage your Graph
What can you do as a defender? The first step is to visualize your network by turning your lists into graphs. Next, implement controls to prune the graph:
- Examine unwanted edges that create huge connectivity bursts. Implement infrastructure partitioning and credential silos to reduce them.
- Reduce the number of admins. Use Just-In-Time / Just Enough techniques for privilege minimization.
- Use two factor authentication to mitigate certain edge traversals.
- Apply a solid credential rotation approach in case a user account is compromised.
- Rethink forest trust relationships.
Learn to Spot List Thinking
Defenders need to ensure that attackers don't have a leg up on them when visualizing the battlefield. In this contest, defenders can have the upper hand. They can have full information about their own network, whereas attackers need to study the network piece by piece. Defenders should take a lesson from how attackers come to understand the graph. Attackers study the infrastructure as it is—not as an inaccurate mental model, viewed from an incomplete asset inventory system, or a dated network diagram. Manage from reality because that's the prepared Defenders Mindset.
Further Reading
There are a number of papers about attack graphs. Here are a few:
Heat-ray: Combating Identity Snowball Attacks Using Machine Learning, Combinatorial Optimization and Attack Graph by J. Dunagan, D. Simon, and A. Zheng, https://alicezheng.org/papers/sosp2009-heatray-10pt.pdf
Two Formal Analyses of Attack Graphs by S. Jha, O. Sheyner and J. Wing, https://www.cs.cmu.edu/\~scenariograph/jha-wing.pdf
Using Model Checking to Analyze Network Vulnerabilities by P. Ammann and R. Ritchey, https://cyberunited.com/wp-content/uploads/2013/03/Using-Model-Checking-to-Analyze-Network-Vulnerabilities.pdf
A Graph-Based System for Network-Vulnerability Analysis by C. Phillips and L. Swiler, https://web2.utc.edu/\~djy471/CPSC4660/graph-vulnerability.pdf
Automated Generation and Analysis of Attack Graphs by J. Haines, S. Jha, R. Lippman, O. Sheyner, J. Wing, https://www.cs.cmu.edu/\~scenariograph/sheyner-wing02.pdf
[And thanks to @4Dgifts for mentioning the two below]
Modern Intrusion Practices by Gerardo Richarte, https://www.blackhat.com/presentations/bh-usa-03/bh-us-03-richarte.pdf
Attack Planning in the Real World by Jorge Lucangeli Obes, Gerardo Richarte, Carlos Sarraute, https://arxiv.org/pdf/1306.4044.pdf
Comments
- Anonymous
January 01, 2003
@JA, My text is what I intended--though it doesn't seem to be clear. i.e. Defenders (often mentally) think they have a list of things to protect, but in reality it's not a list, it's this graph of connected attack surfaces. They need to think about the closure. - Anonymous
January 01, 2003
@Ryan, yes the graphing tool is i2. @jakx_, see my comment above. - Anonymous
April 26, 2015
There's one problem with all of this. Defenders don't have a list of assets. Typo? - Anonymous
April 26, 2015
I read that although defenders have many lists of assets, assets aren't a list, they are a set of relationships best described with a graph. - Anonymous
April 26, 2015
Hmm, interesting graphs. Please could you tell us the name of the tool used to generate them; its a good way to conceptualise and visualise the network in the event of an incident. - Anonymous
April 26, 2015
Lists can represent graphs (see LISP &. al.) The problem isn't necessarily list-orientation, it's that the lists aren't security lists but accounting lists, and accounting lists can't comprehend non-money resources such as technical risk. So the problem stems not from list-thinking but from the fact that businesses are over-oriented to a financial viewpoint. This viewpoint is rewarded in the short term because of the flexibility and adaptability that comes from having money as opposed to other resources, and so is going to be difficult to displace. It's not that security has a list-thinking problem; it's that security is forced to think of things in a purely financial manner. Security needs to find measurable and correct but non-financial value (or at least less directly financial value) in IT things. - Anonymous
April 26, 2015
The comment has been removed - Anonymous
April 27, 2015
Userinsight from Rapid7 - Anonymous
April 27, 2015
The comment has been removed - Anonymous
April 27, 2015
I wrote a library that might help with that kind of work. http://lowrekey.github.io/fourd.js/ - Anonymous
April 27, 2015
Clarifying the suspected typo of comment #1:
"Defenders don't have a list of assets—they have a graph" should be
"Attackers don't have a list of assets—they have a graph" - Anonymous
April 27, 2015
I feel that while this has some truth in it, it's a rather broad and rough over-simplification of both mindsets, and especially the attacker mindset.
I'm not sure if it's a good thing or not- Seeing has most people dealing with cybersec start with a rather limited understanding - maybe simplifying it for them is a good start.
But it could also be damaging if this will lead them to stop at that point and assume that this approach is sufficient.
More on the attacker mindset:
http://landing.edgewave.com/WhitePaper-Choice-Vulnerabilities-Website-Confirmation.html - Anonymous
April 27, 2015
Check out our website for new and refurbished toughbooks and toughpads! http://mooringtech.com/ - Anonymous
April 29, 2015
Great article. For those looking for a way to visualize and protect assets, I suggest looking into Linkurious, a graph visualization startup:http://linkurio.us/ - Anonymous
April 29, 2015
Really enjoyed this article. When you said "Defenders don't have a list of assets—they have a graph" did you mean "attackers"? - Anonymous
April 29, 2015
You just expanded on a tweet you wrote over a year ago. Kind of epic. :D
I still think it's possible to wrap an up to the minute graph topology in a checklist and have the best of both worlds. (aka checklists saving pilots, surgeons, etc) - Anonymous
April 30, 2015
FYI for those who were curious: The graph software used here looks a lot like "i2 Analyst notebook." - Anonymous
May 12, 2015
In theory, I agree. However, I've generally found the opportunity cost of graphing a full network enumeration to be prohibitive, and once you start collapsing network sections, you're back to listing. :) If it's restricted to servers/admins, though, it's very helpful - makes it very easy to visualize credential creep. - Anonymous
June 11, 2015
There is entire community out there that does visualization for security: http:/secviz.org - participate!