Using DebugDiag to capture a dump on First Chance Exception
Capturing memory dumps is a most common ask while troubleshooting performance related issues with web applications. We generally use DebugDiag to do so. Not many are familiar with the tool and hence find it difficult to use it to capture the data.
This time I’ll discuss how to use DebugDiag to generate memory dumps on First Chance Exceptions. Please go through the following blog if you want to know what a first chance exception is:
https://blogs.msdn.com/b/davidklinems/archive/2005/07/12/438061.aspx
I’ll be using DebugDiag v1.2, below is the download link:
https://www.microsoft.com/en-us/download/details.aspx?id=26798
Download and install the tool corresponding to the bitness of the server and not the process i.e., for 32 bit machines download x86 and for 64 bit download x64.
The default installation folder is “C:\Program Files\DebugDiag”
NOTE: Please ensure you have sufficient disk space when using DebugDiag to capture memory dump. The dump files are as big as the process. So if you have a process consuming 600 MB, the dump file would around ~600 MB. If there are many files created then you are running at the risk of crashing the server due to insufficient disk space. |
There are 2 ways to capture FIRST CHANCE EXCEPTION dumps of a process.
- Method 1: Generate a dump for all First Chance Exception or
- Method 2: Target a specific First chance exception (Recommended)
Method 1: Generate a dump for all First Chance Exception
This is the easiest way to capture a dump for any exception that is raised within the process, However this captures unnecessary data and a lot of junk data is generated and hence is never recommended. Below are the steps to configure the same:
Launch DebugDiag
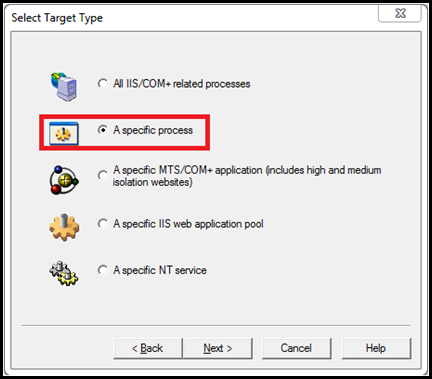
In “Select Target Type” select “A specific process” and click on Next.

Note: If the target is a web application hosted on IIS then, choose either “All IIS/COM+ related processes” or “A specific IIS web application pool”.
In “Select Target” select the target process and click on Next.

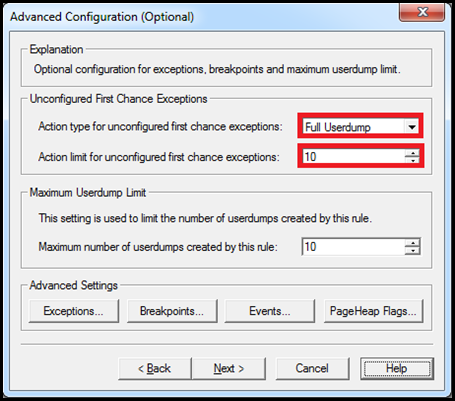
In “Advanced Configuration (Optional) ” under “Unconfigured First Chance Exceptions” set the following:
Click on Next twice and then click on Finish to activate the rule.
This will generate a dump for any unconfigured exception that may occur inside the target process. The file name will be in the following format:
<ProcessName> __ <ApplicationPool> __PID__ <PIDValue> __Date__ <DateValue> __Time_ <TimeValue> __First chance exception <Exception_Code> .dmp
Example:
w3wp__DefaultAppPool__PID__10032__Date__05_09_2012__Time_12_52_51PM__406__First chance exception 0XE0434352.dmp
Method 2: Target a specific First Chance Exception (Recommended)
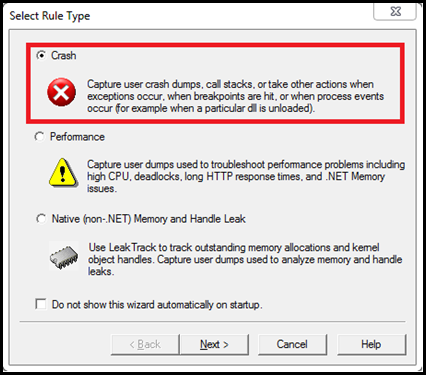
Follow the above method until step 5. Here we will target a specific First Chance Exception. I will be targeting OOM exception for my example/
In “Advanced Configuration (Optional) ” click on the Exceptions… button.
In “First chance Exception Configuration” click on “Add Exception… ”
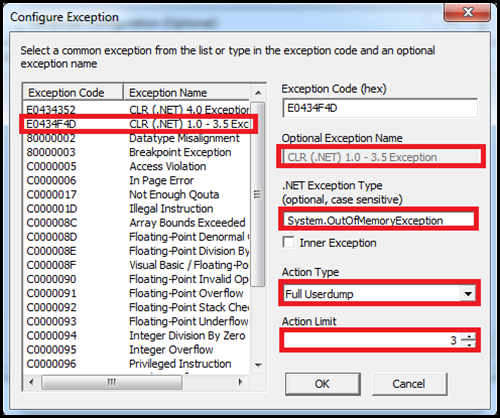
In “Configure Exception” select the Exception code from the LHS and since we are targeting OOM, specify the details as shown below:
NOTE: The Exception type is case sensitive. Ensure it is entered correctly. For more details please visit the following link:https://msdn.microsoft.com/en-us/library/system.systemexception.aspx
Click on Ok and then click on “Save & Close”.
Click on Next twice and then click on Finish to activate the rule.
The dumps created by this rule will be in the following format:
<ProcessName> __PID__ <PID> __Date__ <DateValue> __Time_ <TimeValue> __First Chance <ExceptionName> .dmp
Example:
w3wp__PID__2364__Date__05_09_2012__Time_12_59_51PM__406__First Chance System.OutOfMemoryException.dmp
NOTE: DebugDiag help menu already has documented steps on how to gather data in most of the scenarios. It is preferable to refer that. |
Hope this helps. Until then. Adios! ![]()
Comments
Anonymous
September 17, 2012
HelpfulAnonymous
August 27, 2014
Very good information! It helps a lot.


