Adventures in performance tuning
Been a bit quiet on this blog lately, as most of my postings have ended up on the AppFabric CAT team blog. As part of a recent effort to build a canned LINQPad data context to use with StreamInsight, I went through a few rounds of performance testing to create an application that could (in order of priority):
- Store a large number of events (> 1,000,000) in a human readable format (by human readable, meaning being able to visually review the data through commonly available tools). This generally means text, nothing being friendlier to sharing, converting, manipulating, etc.
- Provide a sufficiently small and portable data size (MB, not GB) to be easily downloaded and moved across the network (i.e. the data must be self-contained)
- Be read performant – provide the ability to retrieve at least 60k events per second on my desktop (as writing the encoded data sets is a 1-time activity, not concerned about optimizing performance).
The intent for this system was to be able to store and replay “canned” data sets for StreamInsight applications. The performance metrics, in order of priority were:
- File size
- Read throughput (target is 100k+ events / second)
- Generic applicability – needs to be relatively non-specific to any conformant data set (see below)
- CPU utilization
- Memory consumption
The “tricks” (constraints, really) I was able to take advantage of were:
- Forward only access to data (i.e. did not need random access to specific data elements).
- Only flat data record schema (StreamInsight doesn’t support nested types in streams).
The reference data set consisted of 733 MB of data downloaded from Environment Canada’s National Climate Archives web site, in XML format. My first pass through performance tuning consisted of evaulating the following techniques:
- Raw XML (to establish a baseline for performance tuning)
- Optimized XML (remove extraneous fields from source XML)
- SQL Compact
- CSV files
- Compressed CSV files (via the most excellent GZipStream class, introduced in .NET 4.0)
In order to perform the testing I needed a benchmark framework which could execute a deterministic test set and capture associated performance data. This framework needed to:
- Provide a pluggable interface for inserting the read/write code which would implement each store/format.
- Measure the key performance metrics
| Download the test frameworks here. |
Stage 1 - Evaluating File Size
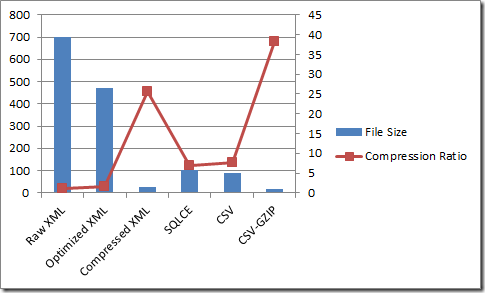
First pass with the full test set were pretty clear – compressed CSV and XML files look to be the clear winner for size (I threw in compressed XML just to be fair). We execute the tests by opening up and executing the PerformanceTests project.
Or, if you prefer the raw data:
| Raw XML | 699.61 | 1 |
| Optimized XML | 471.72 | 1.48 |
| Compressed XML | 27.38 | 25.55 |
| SQLCE | 102.32 | 6.84 |
| CSV | 90.08 | 7.77 |
| CSV-GZIP | 18.28 | 38.28 |
| Based on the first of our ranked performance criteria (file size) , we can now winnow down the field to two clear front runners – compressed XML and CSV format. Now we move on to reviewing read throughput for these two techniques. |
Stage 2 - Evaluating Read Throughput
Now that we’ve winnowed down the field to two candidates, let’s go and test them for read performance. We’ll run four tests here:
- XML Serializer – Compressed
- XML Serializer - Uncompressed
- CSV reader – Compressed
- CSV reader – Uncompressed
Note that we expect the XmlSerializer read performance to suck, as it is designed (and intended) to pull the entire file into memory and provide random access as an in-memory object. Remember one of the constraints we can take advantage of - Forward only access to data – we don’t have to pay the price to load the entire data set into memory for random access. I could have written a forward-parser using XmlTextReader or XElement, but to be honest, making it generic was more work than I wanted to bother with (remember – this has to be readily applicable to all forms of StreamInsight compatible data).
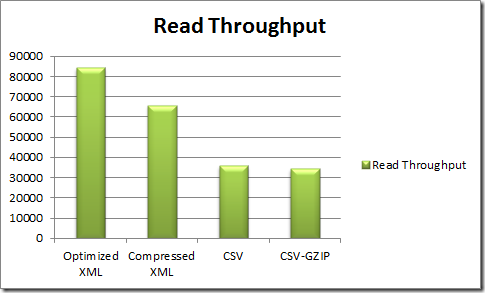
Or, if you prefer the raw data:
| Read Throughput | |
| Optimized XML | 84141.3 |
| Compressed XML | 65799.71 |
| CSV | 35905.47 |
| CSV-GZIP | 34280.79 |
Note that we only lose ~ 13% of our read throughput by leveraging the GZipStream class. That’s pretty awesome ![]()
The numbers for our CSV reader weren’t actually all that good in comparison to the supposedly sucky XmlSerializer. Keep in mind that XmlSerializer is as optimized as it gets, and we haven’t done any optimization work on the CSV reader. Let’s dig a little deeper in to that code to see if we can’t get some solid performance improvements. It’s not measured in the test framework, but there’s a huge memory usage difference between the two (which makes sense, as XmlSerializer loads the whole thing into memory), Using the Red Gate Memory Profiler, companion tool to the Performance Profiler which I use extensively in the next section, the peak values are:
|
Stage 3 – Optimizing the Compressed CSV reader
We’re now pretty close to our goals, but have plenty of room to push the performance envelope. Up to this point we’ve been using relatively simple measures and metrics to quantify and evaluate performance (file sizes via the FileInfo class, and elapsed time via the Stopwatch class). Now that we’re diving a bit deeper into performance tuning, it’s time to pull out the big guns. There are a number of excellent performance and profiling tools available for .NET (including the Visual Studio Profiler). My personal favorite is Red Gate’s excellent, ANTS Performance Profiler, part of their line of .NET Development tools.
One of the reasons this is my go-to application for performance investigations is that when I’m working with customers whom don’t have (or can’t provide) an instrumented build, or cannot install Visual Studio on a live box – it’s a great lightweight experience for understanding how your application is burning CPU and memory.
To follow along through this next section, download an evaluation copy of the ANTS Performance Profiler.
The first thing we’ll do is turn off the other tests in the framework so we can focus on the Compressed CSV path, and disable the file writing (i.e. we just want to execute the file reading code path). To streamline this, we fork the framework into a a separate project, PerformanceTests_Profile.
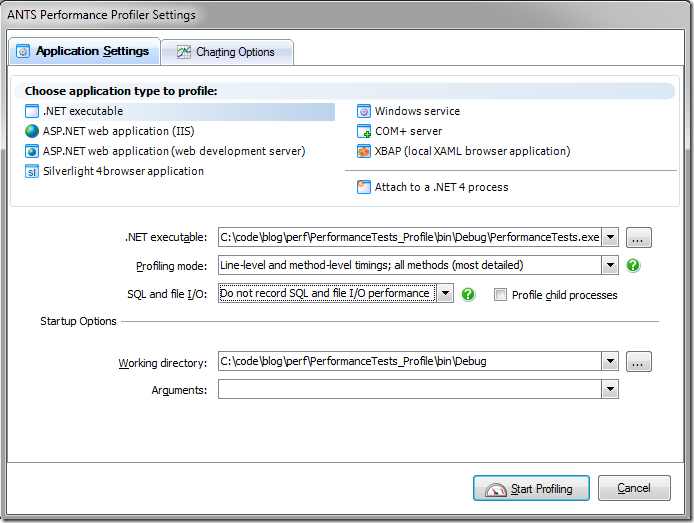
Next, we run the test framework in the ANTS Performance Profiler:
- Start a copy of the ANTS Performance Profiler by clicking on Start, All Programs, Red Gate, ANTS Performance Profiler.
- If the profiler configuration dialog (as per the image below) does not pop up, click on File, New Profiling Session.
- In the .NET executable selection, type in the name of the executable to test (or use the ellipsis to bring up a file browse dialog).
- Select the profiling mode Line-level and method-level timings; all methods (most detailed) .
- Select the SQL and file I/O mode Do not record SQL and file I/O performance.
- Click on Start Profiling.
The profiler will then start up the framework application, and read back the compressed CSV file. Wait until the profiler completes to get a full data set (note that this will take longer than normal due to the overhead of profiling).
Let’s start by looking at the Wall time view – ensure that the 3rd drop down box is set to wall-clock time. This shows two hot paths:
- Waiting for Synchronization. This is busy-wait time while the process waits for the I/O infrastructure (as we’re using synchronous I/O).
- ISequenceRunner.ReadEventsBack. This is the interesting path right now – where are we spending time.
To focus on just our code paths, switch back to CPU time. Waiting for synchronization disappears, and we see MoveNext() – our enumerator method – popping to the top with 97% of time with children (remember that the .Count() method forces the enumerator to run through the entire file). This is where we’ll focus our efforts.
Performance fix 1 – Removing reflection / PropertyInfo.SetValue() and Convert.ChangeType()
Our first approach will be to remove the use of reflection and change type for assigning values. Since we need to maintain a flexibility, we need another “generic” method of assigning values to variables. Since functional programming is cool, let’s approach this problem by defining a function delegate Action<string[], T> that is responsible for assigning values to an object of type T given an array of strings.
This involves updating the signature for ReadEvents<T> as below (the signature change on lines 1-2, and invoking the function delegate on line 25).
- public IEnumerable<TypedEventPayload<T>> ReadEvents<T>(Stream stream,
- Action<string[], T> assign) where T : new()
- {
- StreamReader sr = new StreamReader(stream);
- String line = null;
- var fields = typeof(T).GetProperties();
- var lastField = fields.Last();
- while ((line = sr.ReadLine()) != null)
- {
- if (line.StartsWith("EventShape,"))
- continue;
- string[] tokens = line.Split(new char[] { ',' });
- TypedEventPayload<T> ep = new TypedEventPayload<T>();
- ep.Payload = new T();
- ep.Shape = (EventShape)Enum.Parse(typeof(EventShape), tokens[0]);
- ep.StartTime = DateTime.Parse(tokens[1], CultureInfo.CurrentCulture, DateTimeStyles.AssumeUniversal);
- if (String.IsNullOrEmpty(tokens[2]))
- ep.EndTime = ep.StartTime.AddTicks(1);
- else
- ep.EndTime = DateTime.Parse(tokens[2], CultureInfo.CurrentCulture, DateTimeStyles.AssumeUniversal);
- assign(tokens.Skip(3).ToArray(), ep.Payload);
- yield return ep;
- }
- }
The function definition is fairly straightforward:
- private Action<string[], WeatherReading> assign = (str, e) =>
- {
- e.StationCode = Int32.Parse(str[0]);
- e.Timestamp = DateTime.Parse(str[1]);
- e.Temperature = Double.Parse(str[2]);
- e.DewpointTemperature = Double.Parse(str[3]);
- e.RelativeHumidity = Double.Parse(str[4]);
- e.WindDirection = Double.Parse(str[5]);
- e.WindSpeed = Double.Parse(str[6]);
- e.Visibility = Double.Parse(str[7]);
- e.Humidex = Double.Parse(str[8]);
- e.WindChill = Double.Parse(str[9]);
- e.WeatherConditions = Int32.Parse(str[9]);
- };
This preserves our need for the Csv reading code to be generic (as the parsing code is externally defined and passed in), as well as keeping complexity reasonable. Let’s have a look at our updated performance results.
Based on our profiler results, parsing DateTime values account for 30% of our current CPU time. We have a number of potential performance fixes we can apply here:
- Convert the DateTime storage format to a more easily parsed value (such as raw ticks)
- Parse the date time value using a more optimal parsing routine (such as ParseExact)
Performance fix 2 – Better DateTime parsing
Let’s start by investigating the use of a more optimized DateTime parsing routine – that provided by the XmlConvert class. As XML serialization has been heavily optimized as .NET has evolved, it stands to reason that there may be some optimal parsing algorithms buried in there. Let’s find out ![]()
In order to use XmlConvert.ToDateTime, we also need to change the format in which we encode date time values by altering the WriteEvents method and recreating the data file:
- // Write out the event kind, start time and end time
- sb.Append("Point,");
- sb.Append(XmlConvert.ToString(dtFunc(e)));
- sb.Append(",,");
- foreach (var o in fields)
- {
- // Need special type conversion for DateTime fields
- if (o.PropertyType == typeof(DateTime))
- {
- sb.Append(XmlConvert.ToString((DateTime)
- o.GetValue(e, null), XmlDateTimeSerializationMode.Utc));
- }
- else
- sb.Append(o.GetValue(e, null).ToString());
- if (o != lastField)
- sb.Append(",");
- }
Note the use of XmlConvert on line 3 (using ToString(DateTimeOffset)) and on line 11 (using ToString(DateTime, XmlDateTimeSerializationMode)).
Next, we need to update our parsing methods in ReadEvents<T>
- ep.StartTime = XmlConvert.ToDateTime(tokens[1],
- XmlDateTimeSerializationMode.Utc);
And in the assignment function:
- private Action<string[], WeatherReading> assign = (str, e) =>
- {
- e.StationCode = Int32.Parse(str[0]);
- e.Timestamp = XmlConvert.ToDateTime(str[1],
- XmlDateTimeSerializationMode.Utc);
- e.Temperature = Double.Parse(str[2]);
- e.DewpointTemperature = Double.Parse(str[3]);
- e.RelativeHumidity = Double.Parse(str[4]);
- e.WindDirection = Double.Parse(str[5]);
- e.WindSpeed = Double.Parse(str[6]);
- e.Visibility = Double.Parse(str[7]);
- e.Humidex = Double.Parse(str[8]);
- e.WindChill = Double.Parse(str[9]);
- e.WeatherConditions = Int32.Parse(str[9]);
- };
Let’s go ahead and run this and observe the results.
Now we’re getting there! Download the profile trace to walk through this section. We see the performance culprits being twofold:
Weird. Apparently the format in which we’re storing the StartTime values is more expensive to parse (it stands to reason they’re different – StartTime value is being parsed from a DateTimeOffset record. Wait – we wrote out a DateTimeOffset, but are reading in a DateTime. Could that make a difference? |
Performance fix 3 – Parsing StartTime - DateTimeOffsets not DateTimes
Going back to our change in ReadEvents<T>(), let’s modify it to use XmlConvert.ToDateTimeOffset instead.
- ep.StartTime = XmlConvert.ToDateTimeOffset(tokens[1]);
Wow. Huge difference! Download the profile trace to walk through this section. We now see the performance culprits being centered in the assign function:
Almost there. Let’s make a few small changes to finish this out – let’s switch in the XmlConvert functions for Double.Parse() and Int32.Parse(). |
Performance fix 4 – Parsing numbers with XmlConvert
Ok, let’s modify the assignment method to use XmlConvert instead of Double.Parse:
- private Action<string[], WeatherReading> assign = (str, e) =>
- {
- e.StationCode = Int32.Parse(str[0]);
- e.Timestamp = XmlConvert.ToDateTime(str[1],
- XmlDateTimeSerializationMode.Utc);
- e.Temperature = XmlConvert.ToDouble(str[2]);
- e.DewpointTemperature = XmlConvert.ToDouble(str[3]);
- e.RelativeHumidity = XmlConvert.ToDouble(str[4]);
- e.WindDirection = XmlConvert.ToDouble(str[5]);
- e.WindSpeed = XmlConvert.ToDouble(str[6]);
- e.Visibility = XmlConvert.ToDouble(str[7]);
- e.Humidex = XmlConvert.ToDouble(str[8]);
- e.WindChill = XmlConvert.ToDouble(str[9]);
- e.WeatherConditions = Int32.Parse(str[9]);
- };
Uh-oh – performance regression! Looks like the Double.Parse() is the better function Download the profile trace to walk through this section. Looks like our version 3 is the most performant reader. Having achieved all of our performance goals – let’s call it done! |
Stage 4 – Review
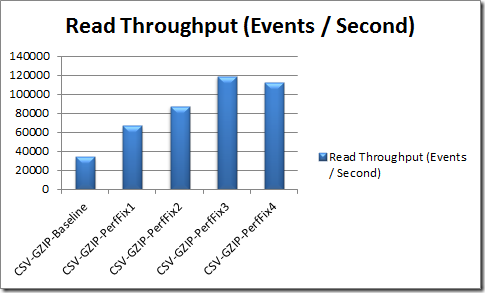
Now that we’ve finished our performance exploration, let’s run the full test suite and review our results and key learnings.
Or, for the raw data:
| Approach | Read Throughput (Events / Second) |
| CSV-GZIP-Baseline | 34066.12 |
| CSV-GZIP-PerfFix1 | 66975.93 |
| CSV-GZIP-PerfFix2 | 87323.21 |
| CSV-GZIP-PerfFix3 | 118614.56 |
| CSV-GZIP-PerfFix4 | 112726.88 |
The key learnings are:
- Know what to measure. Understand what the key performance metrics are, and their relative priority. If you don’t understand where you’re going, you won’t know when you’re there.
- Know how to measure how you got there. Having the right measurement framework in place (matching up with your performance metrics), and the right tooling is critical!
- In this case we were measuring for performance, so a performance profiler was the critical tool that let us achieve a 4x performance gain with about half an hour’s worth of work.
- Having this detailed, repeatable insight is not an option – if you want to be able to tackle performance issues with confidence (and deliver on your projects) you MUST have the right tools, and be able to understand how to profile and tune your code.
- Know when to stop. Performance tuning can become a never ending death spiral if you let it. Understand your performance goals, work towards them, but realize when you start encountering regressions past your performance goals.
- It’s a balance between conflicting priorities.
For more reading on Red Gate’s ANTS Performance profiler check out:
