How to Identify Why an Application Pool is Recycling in IIS 7+ and DebugDiag 2 Fails to Add Managed Breakpoint in .NET 4.6+ in one post
Identifying why Application Pool is recycling
Starting with IIS 7, application recycle for managed Web Applications does not recycle w3wp.exe (IIS Worker Process), instead it simply reload (unload and load a new one) the Application Domain. I mentioned it on another post how to identify the cause of an application pool recycle, but now I will tell how to capture a dump file when it happens.
Capturing a dump when an Application Pool recycles is as easy as capturing a dump file at System.AppDomain.Unload(System.AppDomain) via DebugDiag crash rule. However, when doing this on a machine with .NET 4.6, I was unable to capture the dump. Tinkering a bit I found how to resolve the issue via workaround which I explain later on this post.
After you capturing the dump, it is easy to find the cause if you use NetExt: Getting started with NetExt
Open dump file with WinDbg, load NetExt, index heap with !windex
The run !wruntime to know the cause:
 0:032>; !wruntime
 Runtime Settings per Application Pool

 =========================================================================
 Address         : 0000000DB8DDB100
 First Request   : 10/29/2015 11:34:50 PM
 Runing Time     : 00:00:07
 App Pool User   : IIS APPPOOL\DefaultAppPool
 Trust Level     : Full
 App Domnain Id  : /LM/W3SVC/1/ROOT-4-130906352796685448
 Debug Enabled   : False
 Active Requests : 0n0
 Path            : C:\inetpub\wwwroot\ (local disk)
 Temp Folder     : C:\Windows\Microsoft.NET\Framework64\v4.0.30319\Temporary ASP.NET Files
 Compiling Folder: C:\Windows\Microsoft.NET\Framework64\v4.0.30319\Temporary ASP.NET Files\root\e22c2559\92c7e946
 Shutdown Reason : ConfigurationChange at 10/29/2015 11:34:57 PM

 IIS configuration change
 HostingEnvironment initiated shutdown
 HostingEnvironment caused shutdownn   at System.Environment.GetStackTrace(Exception e, Boolean needFileInfo)
    at System.Environment.get_StackTrace()
    at System.Web.Hosting.HostingEnvironment.InitiateShutdownInternal()
    at System.Web.Hosting.HostingEnvironment.InitiateShutdownWithoutDemand()
    at System.Web.Hosting.PipelineRuntime.StopProcessing()
To identify the file(s) changed, run this command: !wfrom -type System.Web.FileMonitor where ($enumname(_lastAction) == "Modified") $a("==================\nPath",DirectoryMonitor.Directory+"\\"+_fileNameLong),$a("Change Time:",$tickstodatetime(_utcLastCompletion.dateData)),$a("Action",$enumname(_lastAction))
 0:032>; !wfrom -type System.Web.FileMonitor where ($enumname(_lastAction) == "Modified") $a("==================\nPath",DirectoryMonitor.Directory+"\\"+_fileNameLong),$a("Change Time:",$tickstodatetime(_utcLastCompletion.dateData)),$a("Action",$enumname(_lastAction))
 ==================
 Path: C:\inetpub\wwwroot\web.config
 Change Time:: 10/29/2015 11:34:57 PM
 Action: Modified
 ==================

 1 Object(s) listed
 45 Object(s) skipped by filter
Setting a managed Breakpoint for Application pool to catch managed recycling
If you try to add a DebugDiag crash rule when a managed breakpoint is hit, you may fail if .NET 4.6+ is installed. I tested it with DebugDiag 2 Update 1 and it still fails. This is a step-by-step instruction that I sent to a customer having this issue. The instructions also work for people not having the issue, just skip the steps related to .NET 4.6.
*** Update: DebugDiag2 Update 2 resolved the issue that required steps 13 to 16. If you have DebugDiag2 Update 2 skip those steps.
- Download DebugDiag 2 Update 1 and install on the server showing the problem: https://www.microsoft.com/en-us/download/details.aspx?id=42933
- Download DebugDiag 2 Update 2 and install on the server showing the problem: https://www.microsoft.com/en-us/download/details.aspx?id=49924
- Run DebugDiag 2 Collection
- Choose Crash on Rule Type and click Next
4. Then choose A specific IIS web application pool and click Next
5. In the next window, choose the Application Pool you are having problem with (you will see different options in your environment) and click Next
6. In “Action type for unconfigured…” choose Log Stack Trace. In “Action Limit”, write 100. In “Maximum number of userdumps…” choose 1 as below (do not click Next yet):
7. Click on the button Breakpoints. Click on Add Breakpoint…
8. Type mscorlib.dll!System.AppDomain.Unload on Breakpoint Expression. Make sure This is a managed (.NET) breakpoint is selected.. Action Type is to be set to “Full Userdump” and action limit to be set to 1 and click Ok
9. If things are correct you should see the screen below. Then choose “Save & Close”:
10. Click Next
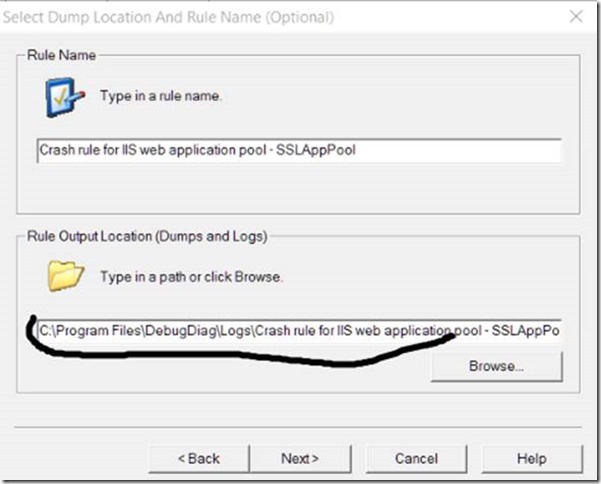
11. By default, the dump will be written in C:\Program Files\DebugDiag\... If you want to save in a different place, change the appropriate filed (it will create the folder if it does not exist:
11. Click Finish (and Yes for any window that pops up):
12. Choose not to activate the rule at this time
* For steps 13 to 16 it is better to have DebugDiag2 Update 2 installed than to make these extra steps
13. (ONLY IF .NET 4.6 is installed and DebugDiag2 Update 1 is being used) Open Notepad as Administrator
14. (ONLY IF .NET 4.6 is installed and DebugDiag2 Update 1 is being used) Open File C:\Program Files\DebugDiag\Scripts\CrashRule_WebAppPool_DefaultAppPool.vbs
15. (ONLY IF .NET 4.6 is installed and DebugDiag2 Update 1 is being used) Locate Function AddBreakpoint and replace until EndFunction by this code (in fact there is only one line added to load sos).
 Function AddBreakpoint(BreakpointExpression, IsManaged)
     Dim LogString
     Dim bpID

     LogString = "Attempting to set "
     If Not IsManaged Then LogString = LogString & "un"
     LogString = LogString & "managed breakpoint at " & BreakpointExpression
     WriteToLog LogString
     ' This is the ONLY line added
     WriteToLog Debugger.Execute(".loadby sos clr")
     ' End of modification

     bpID = Debugger.AddCodeBreakpoint(BreakpointExpression, IsManaged)

     If IsManaged Then
         If bpID < -1 Then
             RecreateDeferredManagedBreakpointExpressionsCollectionIfNecessary
             If IsEmptyOrNothing(g_DeferredManagedBreakpointExpressions) Then Exit Function

             If g_DeferredManagedBreakpointExpressions.Exists(BreakpointExpression) Then
                 g_DeferredManagedBreakpointExpressions(BreakpointExpression) = bpID
             Else
                 g_DeferredManagedBreakpointExpressions.Add BreakpointExpression, bpID
             End If
         End If
     End If

                DbgState("BP_" & BreakpointExpression & "_ID") = bpID

     WriteToLog "bpID = " & bpID

                AddBreakpoint = bpID
 End Function
16. (ONLY IF .NET 4.6 is installed and DebugDiag2 Update 1) Save the file
17. Right-click on the rule and choose activate
Other Approach
I talked to my dear DebugDiag colleague Wade Mascia and he suggested a cleaner approach: to add a custom rule for clr.dll module load. The rule would be simply load sos. This option also makes the export and import of the rule possible. Anyway, this issue should be resolved by next DebugDiag release.


![clip_image001[5] clip_image001[5]](https://msdntnarchive.z22.web.core.windows.net/media/MSDNBlogsFS/prod.evol.blogs.msdn.com/CommunityServer.Blogs.Components.WeblogFiles/00/00/01/05/10/metablogapi/3007.clip_image0015_thumb_6F236E46.jpg)


