Awesomeness Made Easy With PowerBI
Hi all,
My name is Dave Coles and I'm a Senior Premier Field Engineer based in the UK who specializes in SCCM and Application Virtualization.
As we know, creating reports in SCCM using SSRB is a joyful experience second only to having root canal treatment at the Dentist. Therefore when I heard the phrase, "Can I create a dashboard from that….. " from customers, I hid my inner pain and smiled knowing that I was about to lose hours creating the necessary outputs. Recently, customers have been requesting a floor plan "Heat Map", I already know of a customer that uses this and can only assume word has spread.
However, having worked with PowerBI a lot recently, not only can I create this fiendish dashboard easily, but I can do so with a genuine smile (for those who've known me for a few years this is no mean achievement). By following the basic information needed below; you can also achieve the same, smiling lesson excluded.
Items required (links to any downloads will be provided at point of reference).
1) PowerBI , Desktop Edition is suitable.
2) Synoptic Panel Add in by OKviz for PowerBI.
3) A SVG editor, online editor available at https://synoptic.design/ for customers with internet access.
4) A Data Source.
5) A Floor Plan Image.
For this example I am using a generic floor plan image obtained from Bing, which is contained within the Demo Offlice Plan Files Link below.
Additionally, for the data source, I created a test Excel Spreadsheet containing the following fields (Note: Name is my computer name).

First Step was to download and import the Synoptic Panel Add-in.
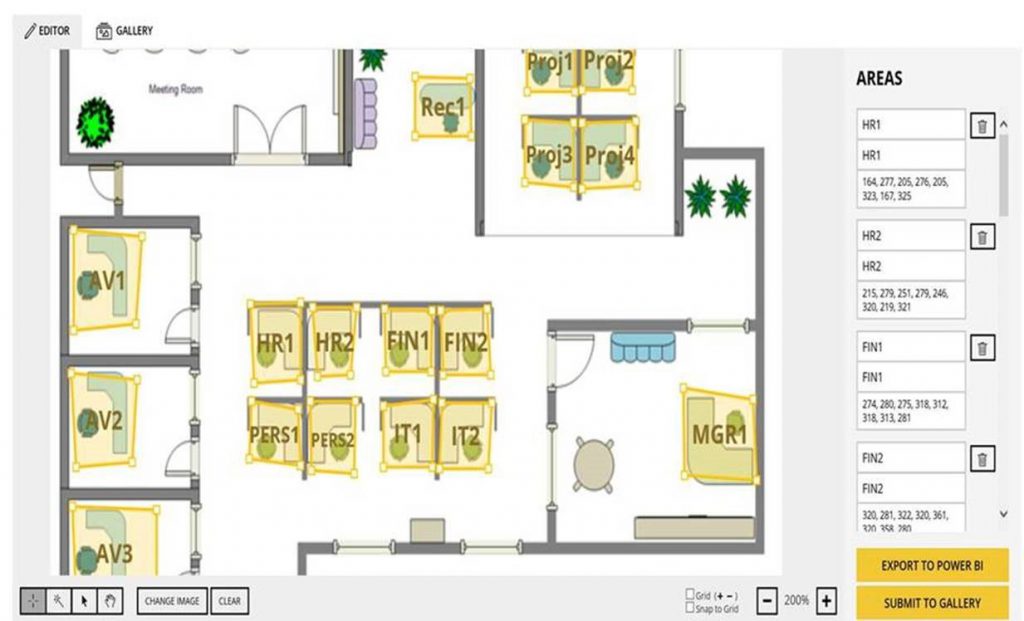
I needed to map the following Computers to areas (zones) on the image that PowerBI would recognise (shown in the next step).
| HR1 | HR |
| HR2 | HR |
| FIN1 | FINANCE |
| FIN2 | FINANCE |
| PERS1 | PERS |
| PERS2 | PERS |
| MGR1 | MGMT |
| IT1 | IT |
| IT2 | IT |
| AV1 | AV |
| AV2 | AV |
| AV3 | AV |
| Proj1 | Projects |
| Proj2 | Projects |
| Proj3 | Projects |
| Proj4 | Projects |
| Rec1 | Reception |
This is achieved by using a SVG editor to create named zones over the image, or put another way, just use the SVG editor to draw squares over each desk and make sure each square is named after the respective computer located there. Image below shows each location (desk) on the image where the corresponding area was created and named accordingly. PowerBI will use the names to map the data to the image.
The completed image was then saved as an SVG to a local folder.
PowerBI was opened and the Synoptic Panel imported as per the following link.
How To Add a Plug in to PowerBI
The Data Source was then added.

Selecting the Synoptic Panel add in places the object into the workspace. Place and size according to your dashboard layout requirements. The floor plan will not be available for import until data has been assigned to the add-in. Example image below shows synoptic panel with no data assigned.
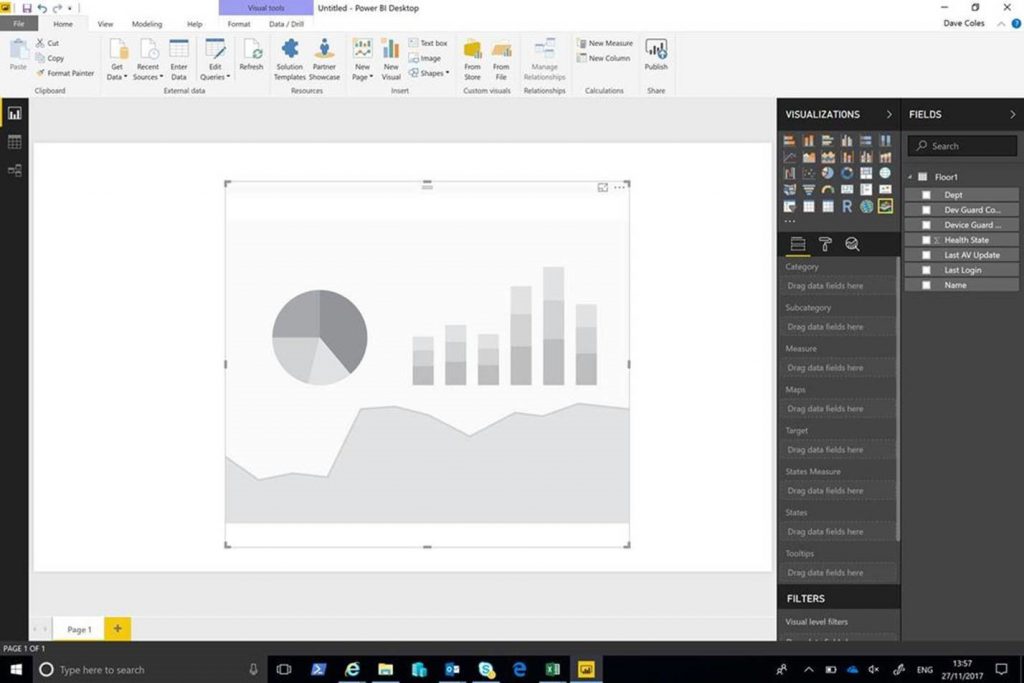
From the fields section the field:
Name was dragged to the corresponding Category Data Area
Last AV Update to the Measure Data Area
Health State to the State Measure Area
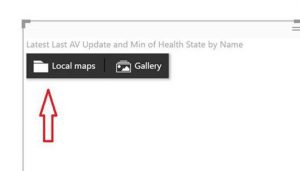
Now the data has been assigned the add in shows an additional tool bar from which the floor plan is imported.
From the format section of the add in Data Labels were enabled and colour states applied for the Health Check settings.
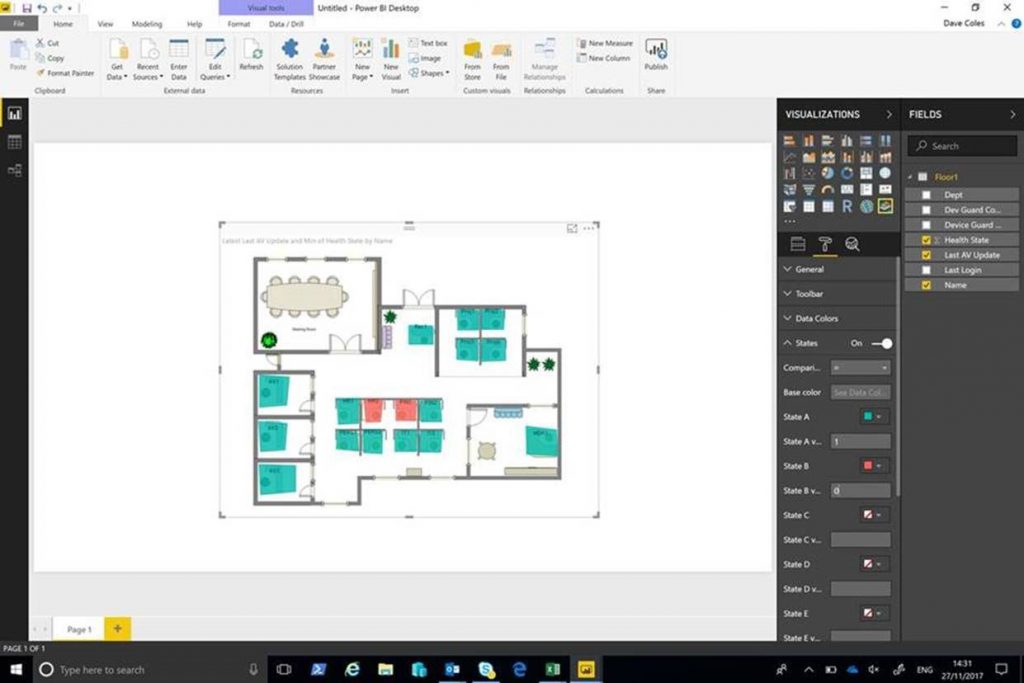
The Floor Plan then reflected the current AV update Status. To demonstrate a more comprehensive dashboard, the following standard components were added.
1) A table showing last login time.
2) A Pie Chart showing Health Status.
3) A Pie Chart showing Device Guard Roll-out Status.
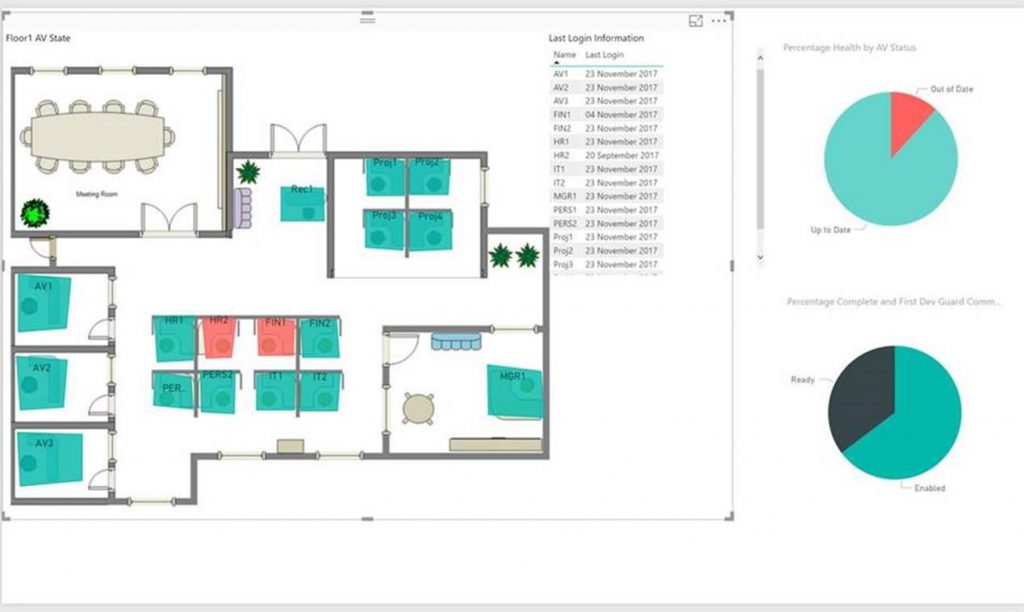
SCCM provides a richer and more dynamic data source. Integrate this with the intuituve interface and flexibilty of PowerBI and you have the ability to create dashboards with ease. No more worries about inner or outer joins, data types or clunky interface. Awesomeness at your fingertips!
So, create away …. and smile
DISCLAIMER
The sample files are not supported under any Microsoft standard support program or service. The sample files are provided AS IS without warranty of any kind. Microsoft further disclaims all implied warranties including, without limitation, any implied warranties of merchantability or of fitness for a particular purpose. The entire risk arising out of the use or performance of the sample files and documentation remains with you. In no event shall Microsoft, its authors, or anyone else involved in the creation, production, or delivery of the files be liable for any damages whatsoever (including, without limitation, damages for loss of business profits, business interruption, loss of business information, or other pecuniary loss) arising out of the use of or inability to use the sample scripts or documentation, even if Microsoft has been advised of the possibility of such damages.
David Coles | Senior Premier Field Engineer | SCCM, Application Virtualisation
