Concurrency Visualizer Feature Grab Bag
In this entry, I’ll dive deep into the following features of the Threads View in the Concurrency Visualizer:
- Thread Sorting
- Thread Hiding
- Visible Timeline Profile Interactivity
- Jumping to Code
- Thread Ready Connector
Thread Sorting
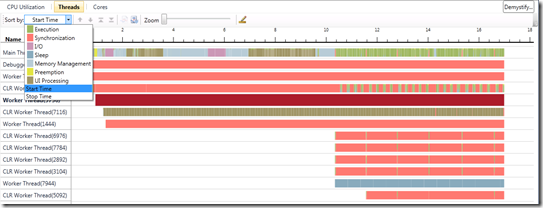
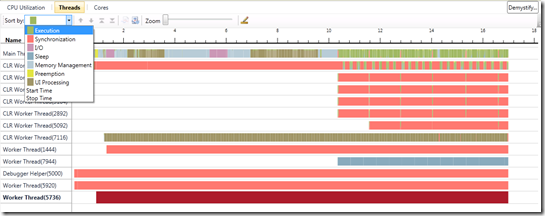
By default, threads are sorted by start time. However, you can sort by any of the thread activity categories shown in the Visible Timeline Profile as well as by stop time. When sorting by a thread activity category, the threads are sorted in decreasing order (from top to bottom) by prevalence of that category (e.g. sorting by synchronization will order the threads such that the top-most thread contains the most synchronization time and the bottom-most thread contains the least). The prevalence of any category is determined in the context of the visible time range. Thus, if zoomed in to a specific region, sorting may yield a different order than zoomed in to a different region (or zoomed all the way out). Therefore, you must re-sort when zooming or panning if you want to be sure that the threads are sorted in the proper order in the context of the visible time range.
Figure 1: Threads sorted by Start Time
Figure 2: Threads sorted by Execution
Thread Hiding
Threads can by hidden by selecting one or more, right clicking, and selecting “Hide”. Hiding threads removes their contribution to the statistics presented in the Visible Timeline Profile and the profile reports. As an example, I’ve found it useful to hide threads in my managed applications such as the Debugger Helper (see “The In-Process Helper Thread” section of this doc page), though there are other threads created by the CLR that you’ll likely find useful to hide. I like to hide this thread because it isn’t a thread created by my application, rather it’s a thread which exists in every CLR process to aid in debugging. Most of the time, it sits in a message loop waiting for messages from the debugger. For this reason, it spends the vast majority of its time blocked, which contributes a significant amount of blocking to the statistics presented in the Concurrency Visualizer. Since I care to understand where my code is causing blocking, I choose to hide this thread. This helps to provide more meaningful thread activity statistics, since they are updated to reflect only the remaining visible threads.
Figure 3: Hiding threads
Visible Timeline Profile Interactivity
The Visible Timeline Profile, which shows statistics for the current visible time range, is interactive. It is through this control that you can access the profile reports. The profile reports present the biggest causes of specific thread activity categories (see the bottom of this page for a description of the thread activity categories).
In the Visible Timeline Profile, you can select the Per Thread Summary, File Operations, or any of the thread activity categories. When you click on any of the thread activity categories a profile report is shown. This report presents statistics for all of the callstacks corresponding to the selected category which occurred in the current visible time range.
For example, figure 4 illustrates the profile report after clicking the Execution category of the Visible Timeline Profile. The report presents the collated execution callstacks which occurred on all unhidden threads in the current visible time range. Thus you can see how many inclusive and exclusive samples were observed for a given execution stack frame.
Figure 4: Clicking on the Visible Timeline Profile
Jumping to Code
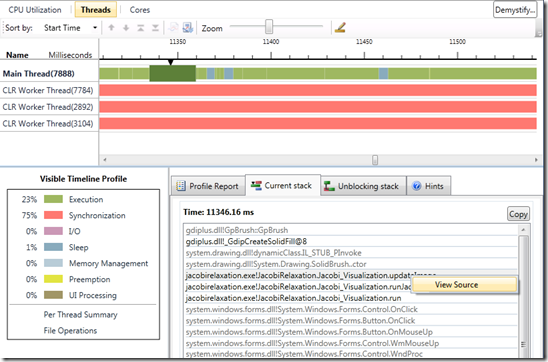
You can jump to code from the callstacks presented in the profile reports, from the Current Stack tab, and from the Unblocking Stack tab. Once identifying a potential performance bottleneck, this is a convenient way to get straight to the suspect source code and fix the problem (simply right-click and select “View Source”). Figure 5 illustrates jumping to source from a callstack revealed after clicking an execution segment in the Threads View.
Figure 5: Getting to source code from the callstack
Thread Ready Connector
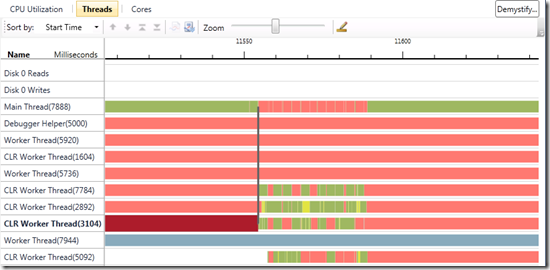
When a thread is unblocked by another thread in same process, the Thread Ready Connector shows you which thread unblocked the selected thread. Note that this is only revealed after selecting the blocking segment (see figure 6).
Figure 6: The Thread Ready Connector shows that the main thread unblocked the CLR Worker Thread (id 3104).
Conclusion
As you can see, the Concurrency Visualizer is feature-rich and not all of the features are obvious. I hope that this provided a good starting point. There are many more features to discuss but in the interest of time, I’ll have to save those for a future entry.
James Rapp – Parallel Computing Platform


