時間グラフ
時間グラフのビジュアルは折れ線グラフの一種です。 クエリの最初の列は x 軸であり、datetime である必要があります。 その他の数値列は y 軸です。 1 つの文字列の列の値を使用して数値列をグループ化し、グラフ内にさまざまな線を作成します。 他の文字列の列は無視されます。 時間グラフのビジュアルは折れ線グラフに似ていますが、x 軸は常に時間になります。
Note
この視覚化は、 render 演算子のコンテキストでのみ使用できます。
構文
T | render timechart [with (propertyName = propertyValue [, ...])]
構文規則について詳しく知る。
パラメーター
| 件名 | タイプ | Required | 説明 |
|---|---|---|---|
| T | string |
✔️ | 入力テーブル名。 |
| propertyName, propertyValue | string |
キーと値のプロパティのペアのコンマ区切りのリスト。 サポートされるプロパティを参照してください。 |
サポートされているプロパティ
すべてのプロパティは省略可能です。
| PropertyName | PropertyValue |
|---|---|
accumulate |
各メジャーの値がすべての先行タスク (true または false) に追加されるかどうか。 |
legend |
凡例を表示するかどうか (visible または hidden)。 |
series |
レコードごとに結合された値によってそのレコードが属する系列が定義される、コンマ区切りの列のリスト。 |
ymin |
Y 軸に表示される最小値。 |
ymax |
Y 軸に表示される最大値。 |
title |
視覚化のタイトル (string 型)。 |
xaxis |
x 軸のスケールを設定する方法 (linear または log)。 |
xcolumn |
x 軸に使用される結果の列。 |
xtitle |
x 軸のタイトル (string 型)。 |
yaxis |
y 軸のスケールを設定する方法 (linear または log)。 |
ycolumns |
x 列の値ごとに提供された値で構成される列のコンマ区切りのリスト。 |
ysplit |
複数の視覚化を分割する方法。 詳細については、「 ysplit プロパティ」を参照してください。 |
ytitle |
y 軸のタイトル (string 型)。 |
ysplit プロパティ
この視覚化では、複数の y 軸値への分割がサポートされています。
ysplit |
説明 |
|---|---|
none |
1 つの y 軸がすべての系列データに表示されます。 (既定) |
axes |
1 つのグラフに、複数の y 軸 (系列ごとに 1 つ) が表示されます。 |
panels |
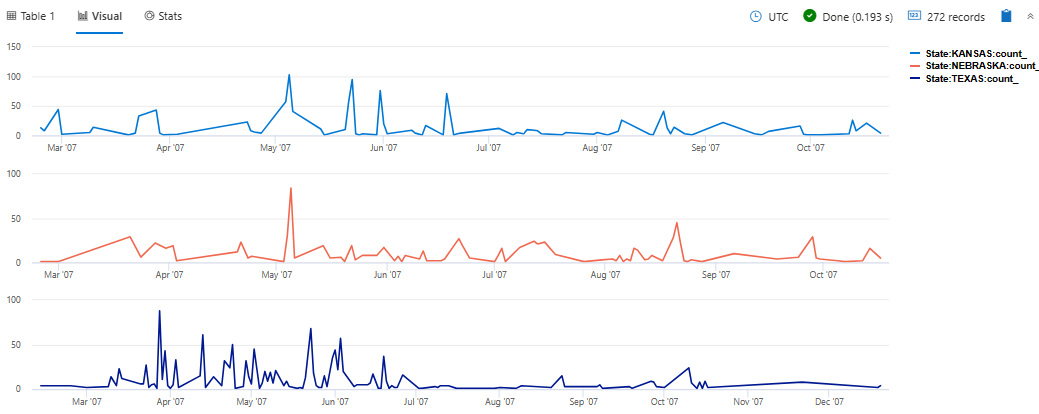
ycolumn の値ごとに 1 つのグラフが表示されます (何らかの上限まで)。 |
例
タイムグラフをレンダリングする
let min_t = datetime(2017-01-05);
let max_t = datetime(2017-02-03 22:00);
let dt = 2h;
demo_make_series2
| make-series num=avg(num) on TimeStamp from min_t to max_t step dt by sid
| where sid == 'TS1'   //  select a single time series for a cleaner visualization
| extend (baseline, seasonal, trend, residual) = series_decompose(num, -1, 'linefit')  //  decomposition of a set of time series to seasonal, trend, residual, and baseline (seasonal+trend)
| render timechart with(title='Web app. traffic of a month, decomposition')
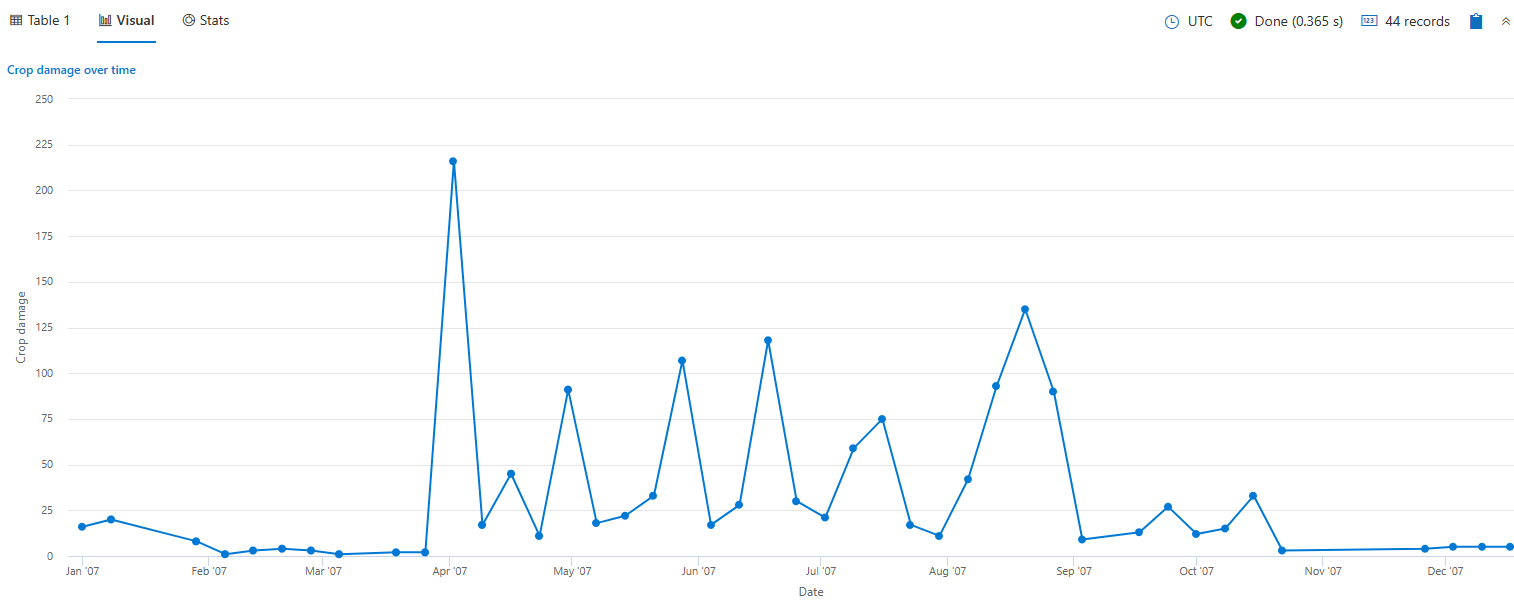
タイム チャートにラベルを付ける
StormEvents
| where StartTime between (datetime(2007-01-01) .. datetime(2007-12-31))
    and DamageCrops > 0
| summarize EventCount = count() by bin(StartTime, 7d)
| render timechart
    with (
    title="Crop damage over time",
    xtitle="Date",
    ytitle="Crop damage",
    legend=hidden
    )
複数の y 軸を表示する
StormEvents
| where State in ("TEXAS", "NEBRASKA", "KANSAS") and EventType == "Hail"
| summarize count() by State, bin(StartTime, 1d)
| render timechart with (ysplit=panels)
関連するコンテンツ
サポートされているプロパティ
すべてのプロパティは省略可能です。
| PropertyName | PropertyValue |
|---|---|
series |
レコードごとに結合された値によってそのレコードが属する系列が定義される、コンマ区切りの列のリスト。 |
title |
視覚化のタイトル (string 型)。 |
例
let min_t = datetime(2017-01-05);
let max_t = datetime(2017-02-03 22:00);
let dt = 2h;
demo_make_series2
| make-series num=avg(num) on TimeStamp from min_t to max_t step dt by sid
| where sid == 'TS1'   //  select a single time series for a cleaner visualization
| extend (baseline, seasonal, trend, residual) = series_decompose(num, -1, 'linefit')  //  decomposition of a set of time series to seasonal, trend, residual, and baseline (seasonal+trend)
| render timechart with(title='Web app. traffic of a month, decomposition')
フィードバック
以下は間もなく提供いたします。2024 年を通じて、コンテンツのフィードバック メカニズムとして GitHub の issue を段階的に廃止し、新しいフィードバック システムに置き換えます。 詳細については、「https://aka.ms/ContentUserFeedback」を参照してください。
フィードバックの送信と表示


