演習 - Scikit-learn を使用して線形回帰を実行する
研究者コミュニティで広く使用されているもう 1 つの一般的な Python ライブラリは scikit-learn です。これは、データから情報を抽出するのに役立つ機械学習モデルを構築することに優れています。 この演習では、scikit-learn (ユニット 2 で既にインポート済み) を使用して NASA の気候データの傾向線を計算します。
ノートブックの下部にある空のセルにカーソルを置きます。 セルの種類を Markdown に変更し、"Perform linear regression with scikit-learn" (scikit-learn を使用して線形回帰を実行する) をテキストとして入力します。
コード セルを追加し、次のコードを貼り付けます。
# Pick the Linear Regression model and instantiate it
model = LinearRegression(fit_intercept=True)

# Fit/build the model
model.fit(yearsBase[:, np.newaxis], meanBase)
mean_predicted = model.predict(yearsBase[:, np.newaxis])

# Generate a plot like the one in the previous exercise
plt.scatter(yearsBase, meanBase)
plt.plot(yearsBase, mean_predicted)
plt.title('scatter plot of mean temp difference vs year')
plt.xlabel('years', fontsize=12)
plt.ylabel('mean temp difference', fontsize=12)
plt.show()

print(' y = {0} * x + {1}'.format(model.coef_[0], model.intercept_))
次に、セルを実行して回帰直線がある散布図を表示します。
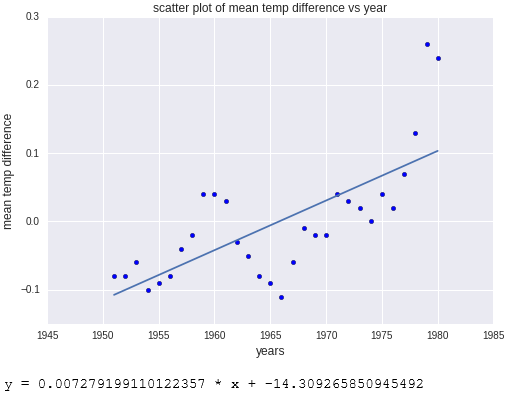
scikit-learn により計算された回帰直線がある散布図
出力は、前の演習の出力とほぼ同じになります。 違いは、scikit-learn の方がより多くの作業が自動的に行われることです。 具体的には、NumPy で行ったような直線の関数のコーディングは、scikit-learn の LinearRegression 関数により行われるため、必要がありません。 Scikit-learn では、洗練された機械学習モデルを構築する場合に便利な、"さまざまな" 種類の回帰がサポートされています。