DevOps の概要
DevOps とは、エンド ユーザーに対する価値の継続的デリバリーを可能にするための、人、プロセス、および製品の結合です。
通常、開発の目標は、より多くの機能をより迅速に提供することであり、運用の目標は、システムの安定性を高めることです。 DevOps により、市場投入までの時間を短縮し、システムの安定性が向上することが実証されているベスト プラクティスのフレームワークを使用することで、このような規範を連携させます。
Microsoft の場合、アイデアから運用環境で実行されているアプリケーションに至るまで、DevOps はソフトウェア リリース ライフサイクル全体を網羅しています。
複数の Microsoft サービスに対する 1 つの包括的な DevOps ビュー
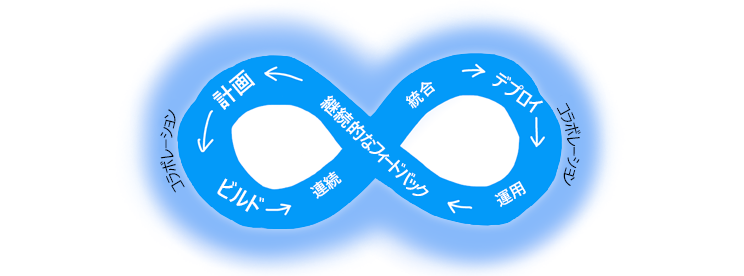
Microsoft では、議論、コラボレーション、改良を重ねた結果、Microsoft サービスに対して次のような DevOps ビューに合意しました。
- まず、人、プロセス、製品から派生した、DevOps を支える 4 本の柱として、カルチャ、リーン 製品、アーキテクチャ、テクノロジを特定しました。
- 次に、8 つの職務、または能力を特定しました。これには、各職務内または複数の職務にまたがるさまざまなプラクティスが含まれます。
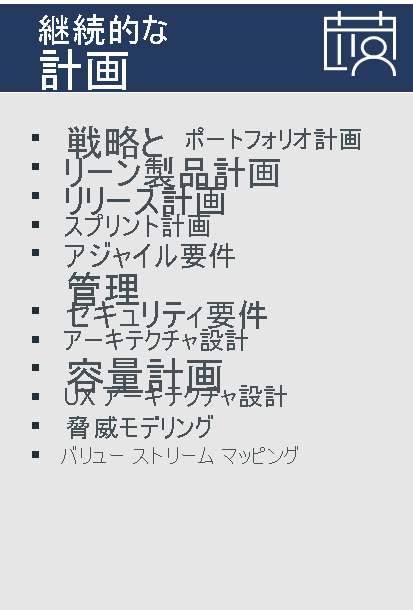
- 継続的計画
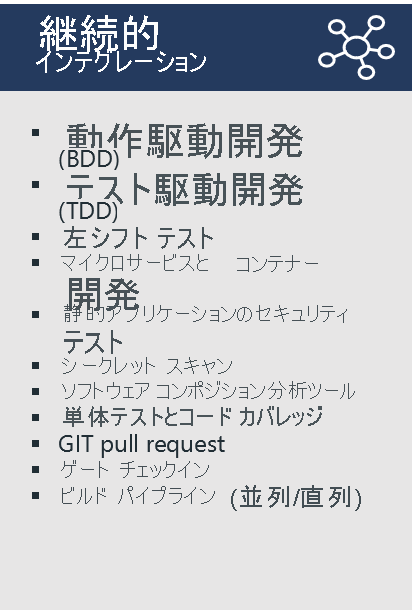
- 継続的インテグレーション
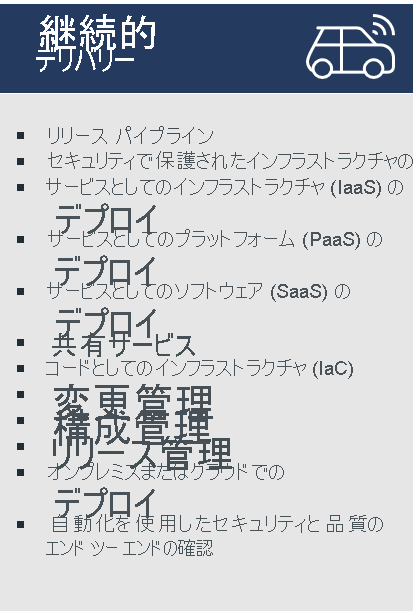
- 継続的デリバリー
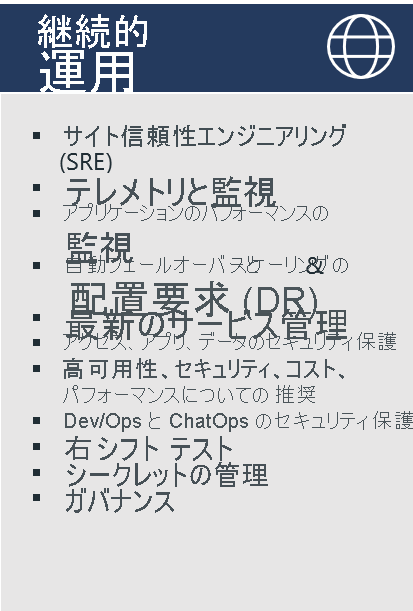
- 継続的運用
- 継続的品質
- 継続的セキュリティ
- 継続的コラボレーション
- 継続的改善
変更点 いずれも継続的です。 このプロセスは過程であり、継続的に進化し、改善するために成長の考え方が必要です。
Note
各機能に示されているのはプラクティス例であることに注意してください。網羅的な一覧ではありません。
DevOps の機能とプラクティス
世界クラスの DevOps プラクティスに組み込まれている機能とプラクティスの DevOps の分類法を次に示します。


Note
各機能に示されているのはプラクティス例であることに注意してください。網羅的な一覧ではありません。
DevOps の利点
2019 State of DevOps レポートは、成長する DevOps 業界の最も包括的なビューを提供する調査に基づいています。
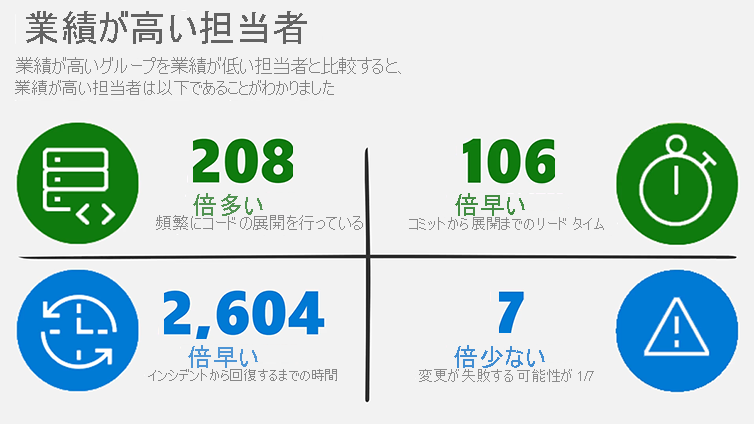
このレポートによると、業績が高い担当者とは次のとおりです。
- 業績が低い担当者の 208 倍の頻度でコードを展開する
- リード タイムのコミットから展開までにかかる時間が業績が低い担当者よりも 106 倍短い
- 故障率を業績が低い担当者よりも 7 倍良く変更する
- 業績が低い担当者よりも 2,604 倍速くサービスを復元する
これらの結果は、DevOps の価値に重点を置いても、チームは安定性のために市場投入の速度を犠牲にすることにはならないことを示しています。 同時に両方を実現できます。