VSTS 2010 Feature: Load Test Excel Report Integration
Now that VSTS 2010 beta 1 is available I will be writing a series of blog posts highlighting new Web and Load testing features. You can get the beta here: beta download
The first feature that I want to review is creating load test run to run comparison reports with excel. With this release we have built integration into excel that will allow you to choose a set of runs and a set of counters and then have the reports automatically generated.
Accessing the new report wizard
First, you need to be running excel on the machine that Visual Studio is installed on. You will only be able to create the reports from that machine. Once created, you will be able to share the excel workbook with other users, but they will not be able to modify the report.
There are 2 ways to access the new report wizard:
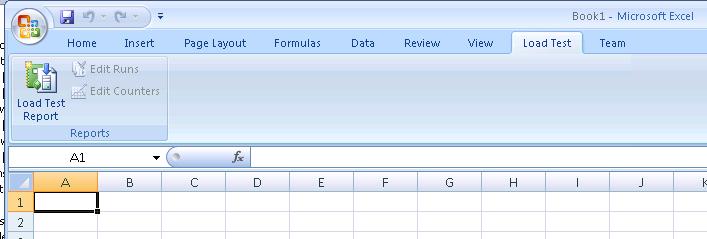
1) Launch Excel – This is easier way. Just launch excel. You will see a new ribbon called Load Test. Click on the load test ribbon.
2) From the load test analyzer – After running a load test and going into post run analysis UI, you will have a new button which will launch excel and then automatically bring up the wizard.
Generating Reports
Let’s walk through creating a report.
1) Launch Excel
2) Click on the Load Test ribbon
3) Click the New Report button. You will also be able to modify existing reports and we will go over that later.
4) When click the button you will see the following:
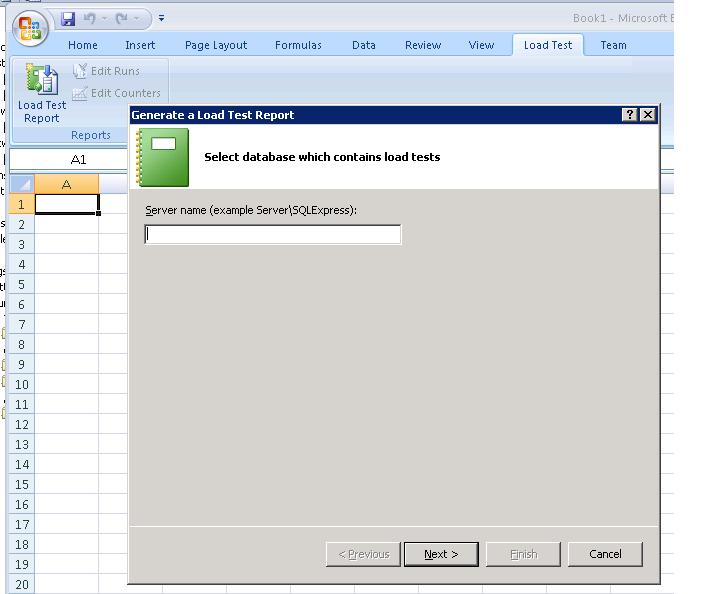
5) On the first page of the wizard, you need to enter the database that the load test results are being stored in. For example, if my database was on a machine called Perf1 and I was using sql express, I would enter Perf1\sqlexpress. Then click next.
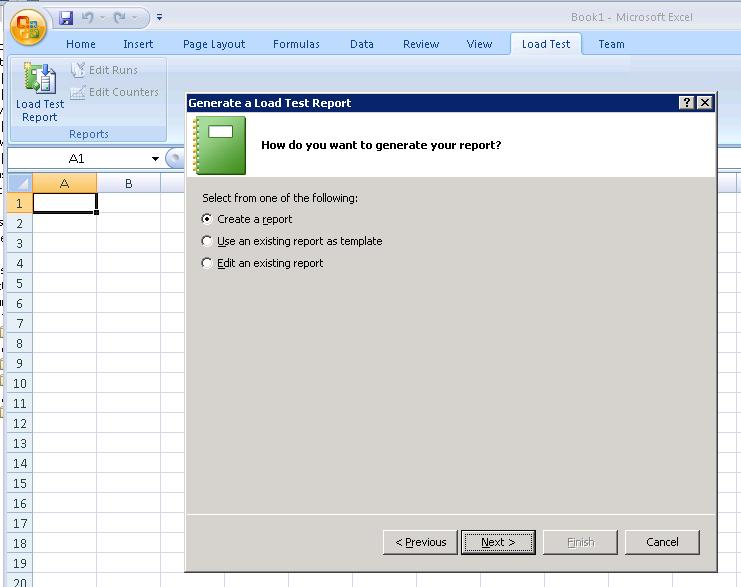
6) On the next page you have 3 options.
a. Create a brand new report.
b. Modify an existing report. This option will allow you to choose a report that you have previously created and regenerate it. You will also be able to modify settings such as runs to display or counters to display. The reason that we can do this is that the report definitions are stored in the load test results store. When we get to the end of the wizard and click finish, the report definition including runs and counters will be stored. That way if you lose your workbook and need to recreate the report, you can just pull it up and recreate it.
c. Use an existing report as a template – This is useful if you have created a report that has all of the counters that you like to see. You will see on the next screen that you need to choose a load test for the report. Then you will be presented will all of the runs for that load test. So if you have created a report for load test 1 and now want to use it for load test 2, you would choose this option.
Choose Create a Report and click Next.
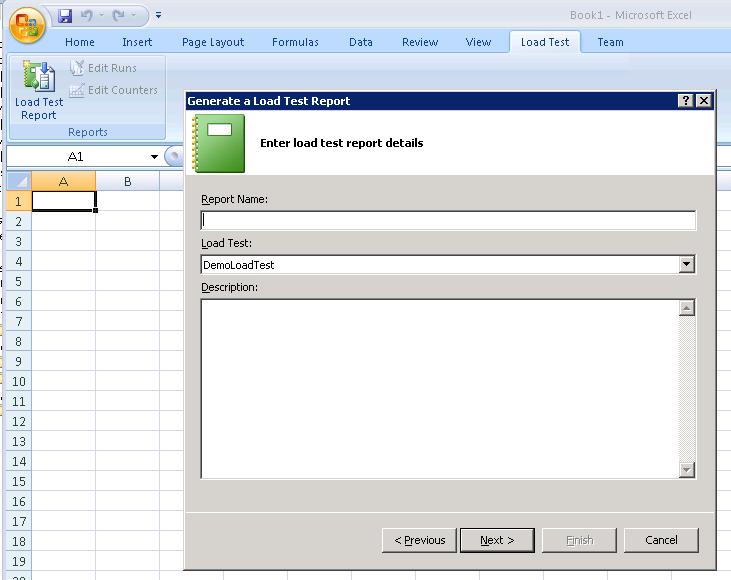
7) On this screen you need to enter a name for the report and choose a load test.
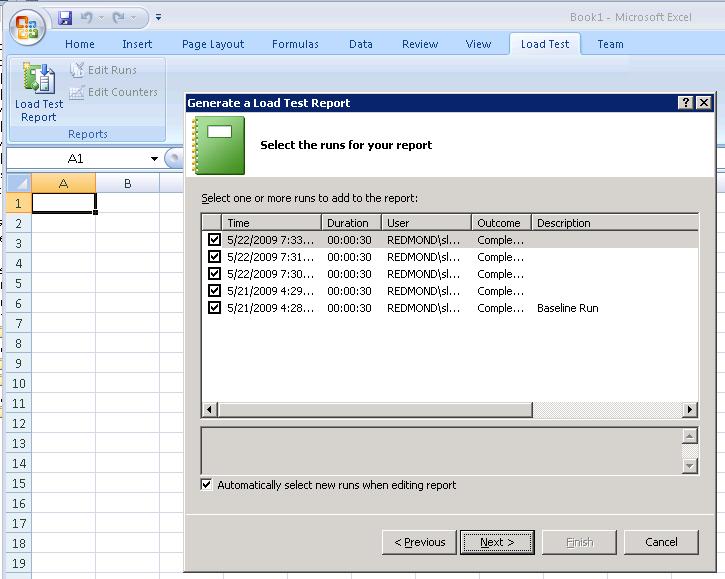
8) The next screen will display all of the runs associated with the load test. If you have added analysis notes to the run, they will be displayed. Here is a blog post adding these notes. They will become very useful when selecting runs: Adding Analysis Notes. Select the runs you want to include and then click next.
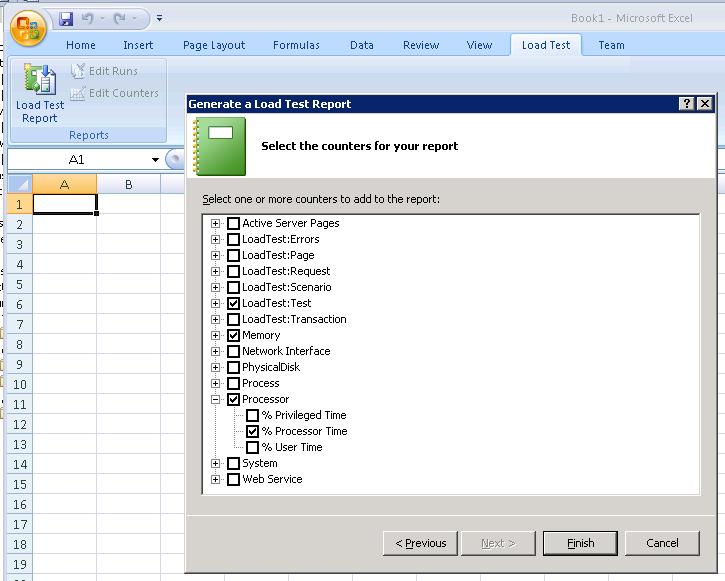
9) The next screen will show you all the of the counters that are available to graph. This will include all counters you collected for the runs that were selected. Select a few counters and click Finish.
10) Now the set of reports will be automatically generated.
Viewing the Reports
The reports which are generated will be a set of pivot tables and charts.
Here are the set of reports that will be created.
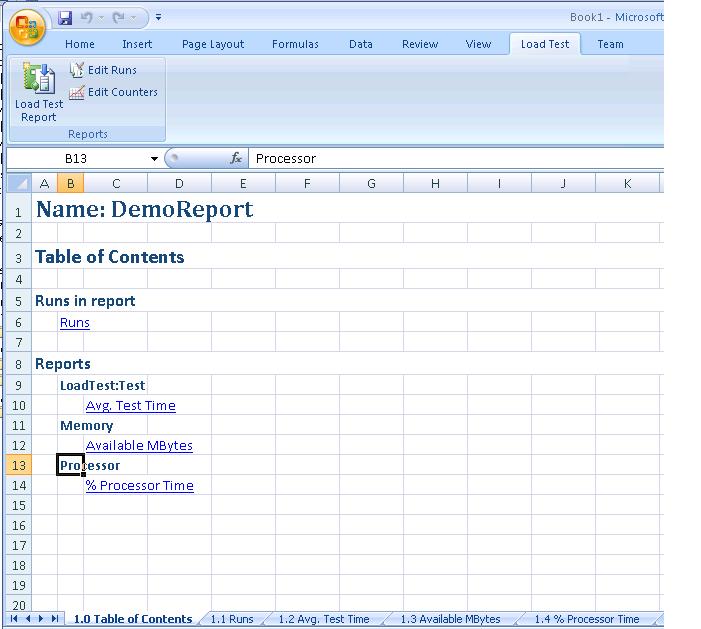
1) Table of Contents – This will display the name as well as hyper links to each of the reports that were created.
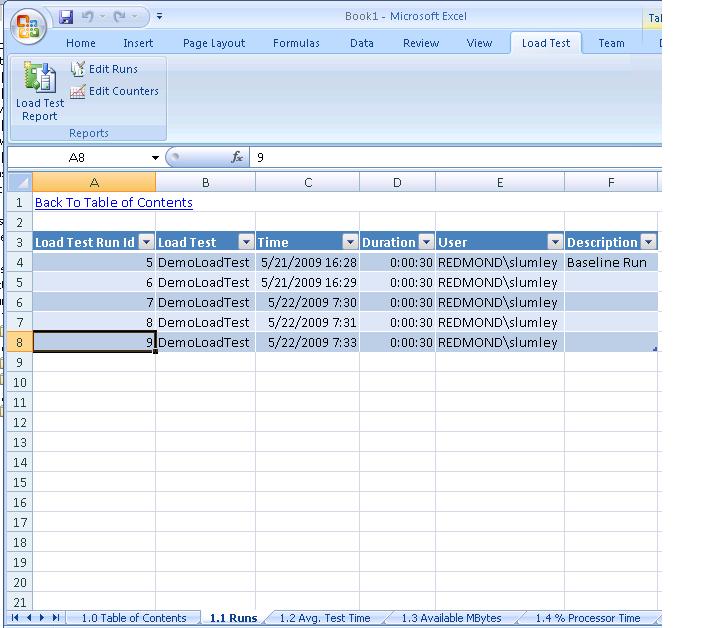
2) Runs – This worksheet will show you each of the runs that were selected:
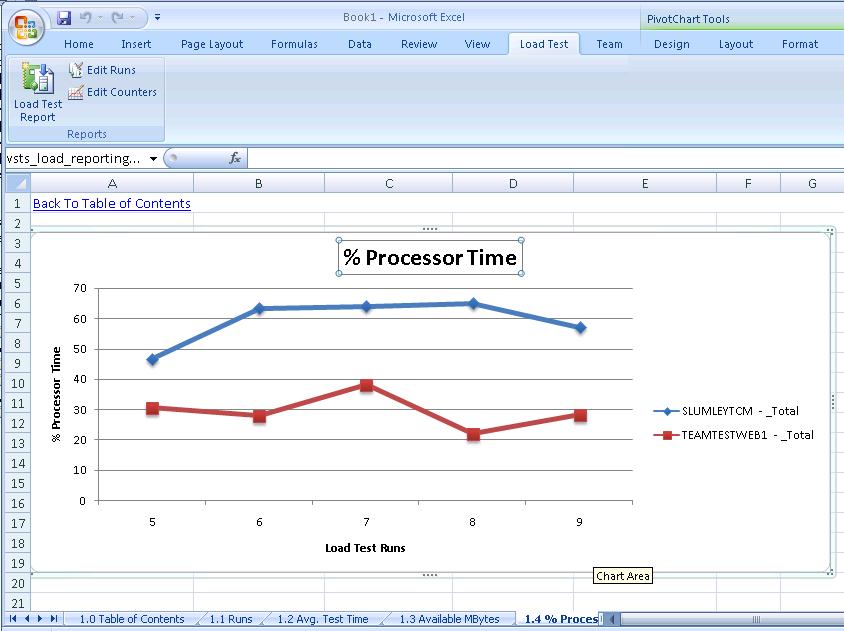
3) Reports for counters. – Then you will have one worksheet for each counter selected. The x axis is the run number. So this will give you an idea of how the counter is trending from run to run .
Editing Existing Reports
After generating the report, you can modify a few things. You can change the selected runs and the selected counters.
1) Click the Load Test ribbon again.
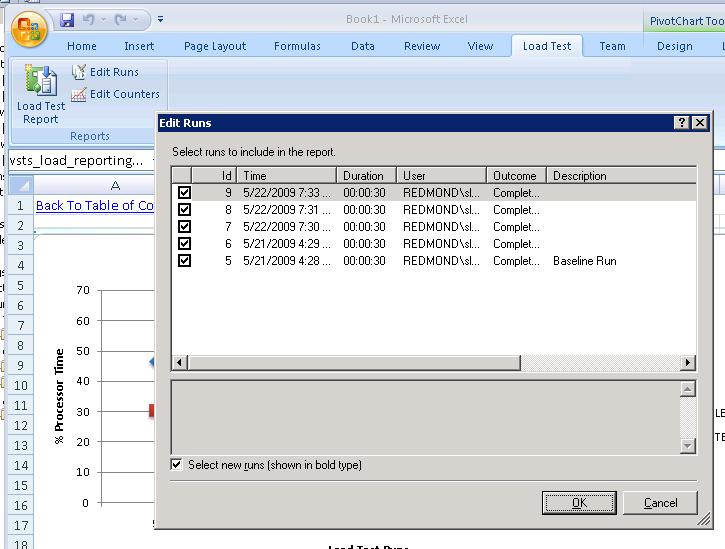
2) Click the Edit Runs button. This will display the runs that are currently displayed. You can remove runs or maybe you want to add runs which have completed since you generated the report.
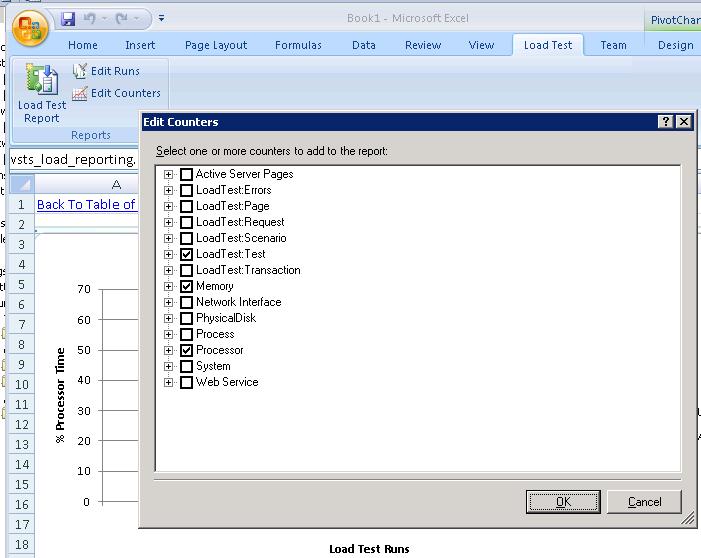
3) Click the Edit Counters button. This will allow you to change the set of counters that are displayed.
Sharing Reports
As mentioned above, once you have generated the report, you can share the workbook. You will only be able to modify the workbook on a machine that has VS installed on it. Other users will not see the Load Test ribbon, but they will be able to view the workbook.
Hopefully this feature will help with creating reports that can be shared with the rest of your team. Please provide feedback on this feature.
Comments
Anonymous
May 22, 2009
PingBack from http://microsoft-sharepoint.simplynetdev.com/vsts-2010-feature-load-test-excel-report-integration/Anonymous
June 11, 2009
Beta 1 was released to the web today for MSDN subscribers. If you are a MSDN subscriber, you can downloadAnonymous
November 14, 2009
I met a problem during Create a New Report on the second step: The load Test option is blank and I can't select a Load Test. I run Excel2007 and VSTS2010 on the same machine. Could you please help to do the trouble shooting? Thanks.Anonymous
November 17, 2009
Sure. Are you using beta2 or beta1?Anonymous
January 11, 2010
The comment has been removedAnonymous
January 21, 2010
I am looking for a video demo of VSTS 2010 load testing . Any good site to suggest?Anonymous
March 10, 2010
The comment has been removedAnonymous
March 10, 2010
Answer to question about vidoe. I don't know of any. Best resources I know of are probably my blog and Ed Glas's blog.Anonymous
April 03, 2011
I have posted this question in Ed's blog before I found this post so I am posing the question again just in case. In VSTS 2010 we now have the ability to creat Excel reports from a completed load test. This is fantastic. However, I am stuck on how to create a trend or comparison report from two load tests with different names ? Example, I have run a load test named 'a' and from the results I want to create a trend report using the results of a load test named 'b'. This is not currently possible as the Excel load test report can open only one load test from the repository at a time. I have found a workaround for that, by keeping the load test name the same and changing only the scenarios inside the load test to whatever I need. This way I can create trend reports of all scenarios within a giving load test. But that does not always make logical sense from a load test plan perspective and I still need to do the trend over the older sets of load tests, i.e. I need to select two different load test names and select test results across the two. Any ideas on this would be appreciated.Anonymous
April 20, 2011
When I attempt to create a load test trend report in Excel I get a crash and the following error message: Unspecified error (Exception form HRESULT: 0x80004005 (E_FAIL)) This happens in both Office 2007 and 2010. My test runs complete without issue and I can generate run comparison reports just fine. Only trend reports are having this problem. I've scoured the web and there is very little discussion on this tool let alone this issue; Help!!!Anonymous
June 16, 2011
i also get the error message like vagwada, are there any solution?Anonymous
September 01, 2011
Is there a solution to vagwada and horts issueAnonymous
October 03, 2011
The solution is to generate your trend report with only one test run then add additional runs one at a time from within the report itself. Also try to keep the number of counters down as too many can cause problems in Excel resulting in empty graphs. Good luck!Anonymous
November 05, 2013
Hi after completing Load test my create excel icon is disable, I m having VS 2012 ultimate & MS office 2007,I have try to add the COM add-in but its not working,pls help me out from this...Anonymous
February 06, 2014
Hi, when i try to creat a Trend report, i get an error "Object reference is not set to instance of the object". it starts creating reports but as soon as it try to populate data on second sheet of excel, this error appears. Can anyone help me to get it resolved?Anonymous
March 09, 2015
Hi, I am using LoadTest Report addin in Excel 2013 to connect to Visual Studio WebTest Report database(LoadTest2010). Its a great addin for extracting and comparing two runs from LoadTest. But there is no feature for specifying the start and end time for each test so that i can avoid rampup and ramdown time in my test and just compare only the steady state of the test. Is there a way to customize this addin to specify the start and end times, also specify 90th percentile comparison etc... Appreciate your help Thanks