Building lightweight dashboards using Excel
TFS work items can provide a wealth of information that can be used for decision making and analysis, answering questions like:
- Are we on track?
- Is our bug debt growing or shrinking?
- What is our incoming/fix/close rate?
and many others…
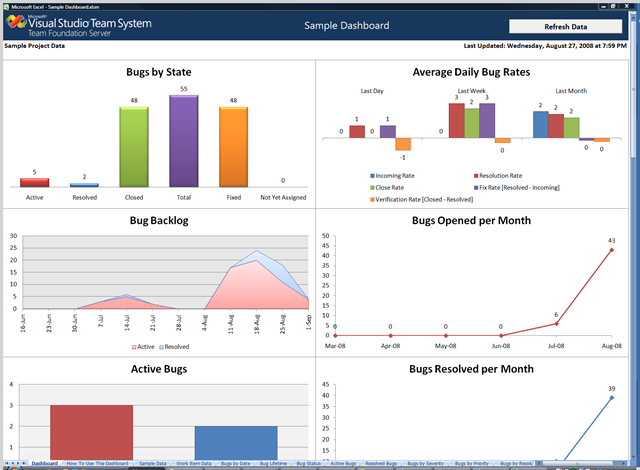
One way of keeping on top of the daily status is by building dashboards that help you summarize and clearly visualize all this information (this is particularly useful for driving triage and also for retrospective analysis).
Here is a sample dashboard that you can use to track your projects. It pulls data from a work item query to showcase some of these metrics, including bug counts, incoming/fix/close rates, bug backlogs, bug lifetimes, and more!
This sample Excel dashboard is designed to work with a project that uses the VSTS Agile Process for Software Development. Detailed usage instructions are available in the How to use this Dashboard sheet. Feel free to download it (with the disclaimer, “provided as is, you are responsible for its use”) and take it for a test drive, open it during status meetings, use it, and enhance it... We hope that it is valuable both as an example and as a starting point for leveraging the full power of work items.
Here is another post from Ameya that uses similar techniques (also has a video that might give you more details).
Feedback and comments always welcome... Enjoy!
Ben
Comments
Anonymous
February 12, 2009
PingBack from http://www.clickandsolve.com/?p=7109Anonymous
February 12, 2009
Buenas, como ya muchos saben, me encanta explotar la información que posee Team Foundation Server enAnonymous
February 12, 2009
Buenas, como ya muchos saben, me encanta explotar la información que posee Team Foundation Server enAnonymous
February 12, 2009
Buenas, como ya muchos saben, me encanta explotar la información que posee Team Foundation ServerAnonymous
February 18, 2009
The Team System Events Blog on February is "Build Month" at the online Team System User GroupAnonymous
February 20, 2009
Great proof of concept! Is it just me, or are the Bugs by Date and Lifetime charts broken in your example ?Anonymous
February 20, 2009
Hi Homerus... I'm not quite sure what you mean by them being broken? What is it that you are seeing or not seeing? Thanks, BenAnonymous
February 25, 2009
The comment has been removedAnonymous
February 25, 2009
Hi, never mind, I found the solution. It was indeed my regional settings, the fields between brackets had to be seperated with a semicolon in stead of a comma, and the #All setting had to be in Dutch. Thanks for a great sheet! Homerus.Anonymous
February 27, 2009
Homerus, that's fantastic, I'm glad it worked for you. I've also learned that regional settings might play a factor in interpreting those strings. Thanks! BenAnonymous
March 03, 2009
I’m going to add this blog to my links on the left—I go out here often, and I frequently mail these articlesAnonymous
April 19, 2009
Le lien ci-dessous vous permettra de créer un ensemble de graphiques basé sur une requête de Work Items