บทช่วยสอน: สร้าง ประเมิน และให้คะแนนระบบคําแนะนํา
บทช่วยสอนนี้แสดงตัวอย่างแบบ end-to-end ของเวิร์กโฟลว์ Synapse Data Science ใน Microsoft Fabric สถานการณ์สร้างแบบจําลองสําหรับคําแนะนําหนังสือออนไลน์
บทช่วยสอนนี้ครอบคลุมขั้นตอนเหล่านี้:
- อัปโหลดข้อมูลลงในเลคเฮ้าส์
- ดําเนินการวิเคราะห์เชิงสํารวจเกี่ยวกับข้อมูล
- ฝึกแบบจําลองและบันทึกด้วย MLflow
- โหลดแบบจําลองและคาดการณ์
เรามีอัลกอริทึมคําแนะนําหลายประเภทที่พร้อมใช้งาน บทช่วยสอนนี้ใช้อัลกอริทึมการสร้างปัจจัยเมทริกซ์อย่างน้อยสแควร์ (ALS) ALS เป็นอัลกอริทึมการกรองที่ทํางานร่วมกันตามแบบจําลอง
ALS พยายามประมาณเมทริกซ์การให้คะแนน R เป็นผลิตภัณฑ์ของเมทริกซ์อันดับต่ํากว่าสองรายการ คุณและ V ที่นี่ R = U * Vt โดยทั่วไปแล้ว การประมาณค่าเหล่านี้เรียกว่าปัจจัย เมทริกซ์
อัลกอริทึม ALS เป็นแบบซ้ํา การทําซ้ําแต่ละครั้งจะมีค่าคงที่ของเมทริกซ์ปัจจัยหนึ่งในขณะที่ช่วยแก้ปัญหาอีกตัวหนึ่งโดยใช้วิธีการสี่เหลี่ยมน้อยที่สุด จากนั้นจะคงเมทริกซ์ปัจจัยที่แก้ไขใหม่ในขณะที่แก้ไขเมทริกซ์ปัจจัยอื่น ๆ
ข้อกําหนดเบื้องต้น
รับ การสมัครใช้งาน Microsoft Fabric หรือลงทะเบียนสําหรับ Microsoft Fabric รุ่นทดลองใช้ฟรี
ลงชื่อเข้าใช้ Microsoft Fabric
ใช้ตัวสลับประสบการณ์การใช้งานที่ด้านล่างซ้ายของหน้าหลักของคุณเพื่อเปลี่ยนเป็น Fabric

- หากจําเป็น ให้สร้าง Microsoft Fabric lakehouse ตามที่อธิบายไว้ใน สร้างเลคเฮ้าส์ใน Microsoft Fabric
ติดตามในสมุดบันทึก
คุณสามารถเลือกหนึ่งในตัวเลือกเหล่านี้เพื่อติดตามในสมุดบันทึกได้:
- เปิดและเรียกใช้สมุดบันทึกที่มีอยู่ภายใน
- อัปโหลดสมุดบันทึกของคุณจาก GitHub
เปิดสมุดบันทึกที่มีอยู่แล้วภายใน
ตัวอย่าง คําแนะนําหนังสือ สมุดบันทึกมาพร้อมกับบทช่วยสอนนี้
เมื่อต้องการเปิดสมุดบันทึกตัวอย่างสําหรับบทช่วยสอนนี้ ให้ทําตามคําแนะนําใน เตรียมระบบของคุณสําหรับบทช่วยสอนวิทยาศาสตร์ข้อมูล
ตรวจสอบให้แน่ใจว่า แนบ lakehouse เข้ากับ สมุดบันทึกก่อนที่คุณจะเริ่มเรียกใช้โค้ด
นําเข้าสมุดบันทึกจาก GitHub
AIsample - Book Recommendation.ipynb notebook มาพร้อมกับบทช่วยสอนนี้
เมื่อต้องการเปิดสมุดบันทึกที่มาพร้อมกับบทช่วยสอนนี้ ให้ทําตามคําแนะนําใน เตรียมระบบของคุณสําหรับบทช่วยสอนวิทยาศาสตร์ข้อมูล การนําเข้าสมุดบันทึกไปยังพื้นที่ทํางานของคุณ
ถ้าคุณต้องการคัดลอกและวางโค้ดจากหน้านี้ สร้างสมุดบันทึกใหม่
ตรวจสอบให้แน่ใจว่า แนบ lakehouse เข้ากับ สมุดบันทึกก่อนที่คุณจะเริ่มเรียกใช้โค้ด
ขั้นตอนที่ 1: โหลดข้อมูล
ชุดข้อมูลคําแนะนําของสมุดในสถานการณ์นี้ประกอบด้วยชุดข้อมูลที่แยกต่างหากสามชุด:
Books.csv: หมายเลขหนังสือมาตรฐานสากล (ISBN) ระบุหนังสือแต่ละเล่ม โดยลบวันที่ที่ไม่ถูกต้องออกแล้ว ชุดข้อมูลยังประกอบด้วยชื่อเรื่อง ผู้เขียน และผู้เผยแพร่ สําหรับหนังสือที่มีผู้เขียนหลายคนไฟล์ Books.csv แสดงเฉพาะผู้เขียนคนแรก URL ชี้ไปยังแหล่งข้อมูลเว็บไซต์ Amazon สําหรับภาพหน้าปกในสามขนาด
ISBN Book-Title Book-Author ปี-Of-Publication ผู้พิมพ์ รูปภาพ-URL-S รูปภาพ-URL-M Image-URL-l 0195153448 ตํานานคลาสสิค Mark P. O. Morford 2002 สื่อประชาสัมพันธ์มหาวิทยาลัย Oxford http://images.amazon.com/images/P/0195153448.01.THUMBZZZ.jpg http://images.amazon.com/images/P/0195153448.01.MZZZZZZZ.jpg http://images.amazon.com/images/P/0195153448.01.LZZZZZZZ.jpg 0002005018 Clara Callan ริชาร์ด บรูซ Wright 2001 ฮาร์เปอร์ฟลามิงโก แคนาดา http://images.amazon.com/images/P/0002005018.01.THUMBZZZ.jpg http://images.amazon.com/images/P/0002005018.01.MZZZZZZZ.jpg http://images.amazon.com/images/P/0002005018.01.LZZZZZZZ.jpg Ratings.csv: การให้คะแนนสําหรับหนังสือแต่ละเล่มมีความชัดเจน (มาจากผู้ใช้ในระดับ 1 ถึง 10) หรือโดยนัย (สังเกตได้โดยไม่ต้องมีการป้อนข้อมูลของผู้ใช้และระบุด้วย 0)
User-ID ISBN Book-Rating 276725 034545104X 0 276726 0155061224 5 Users.csv: รหัสผู้ใช้ไม่ระบุตัวตน และแมปกับจํานวนเต็ม ข้อมูลประชากร - ตัวอย่างเช่น มีตําแหน่งที่ตั้งและอายุ (ถ้ามี) ถ้าข้อมูลนี้ไม่พร้อมใช้งาน ค่าเหล่านี้จะถูก
nullUser-ID สถานที่ อายุ 1 "นิวยอร์ค นิวยอร์ค สหรัฐอเมริกา" 2 "Stockton california usa" 18.0
กําหนดพารามิเตอร์เหล่านี้เพื่อให้คุณสามารถสมุดบันทึกนี้ด้วยชุดข้อมูลที่แตกต่างกัน:
IS_CUSTOM_DATA = False  # If True, the dataset has to be uploaded manually

USER_ID_COL = "User-ID"  # Must not be '_user_id' for this notebook to run successfully
ITEM_ID_COL = "ISBN"  # Must not be '_item_id' for this notebook to run successfully
ITEM_INFO_COL = (
    "Book-Title"  # Must not be '_item_info' for this notebook to run successfully
)
RATING_COL = (
    "Book-Rating"  # Must not be '_rating' for this notebook to run successfully
)
IS_SAMPLE = True  # If True, use only <SAMPLE_ROWS> rows of data for training; otherwise, use all data
SAMPLE_ROWS = 5000  # If IS_SAMPLE is True, use only this number of rows for training

DATA_FOLDER = "Files/book-recommendation/"  # Folder that contains the datasets
ITEMS_FILE = "Books.csv"  # File that contains the item information
USERS_FILE = "Users.csv"  # File that contains the user information
RATINGS_FILE = "Ratings.csv"  # File that contains the rating information

EXPERIMENT_NAME = "aisample-recommendation"  # MLflow experiment name
ดาวน์โหลดและจัดเก็บข้อมูลในเลคเฮ้าส์
รหัสนี้จะดาวน์โหลดชุดข้อมูล และจากนั้นเก็บไว้ในเลคเฮ้าส์
สําคัญ
อย่าลืม เพิ่มเลคเฮาส์ ลงในสมุดบันทึกก่อนที่คุณจะเรียกใช้ มิฉะนั้น คุณจะได้รับข้อผิดพลาด
if not IS_CUSTOM_DATA:
    # Download data files into a lakehouse if they don't exist
    import os, requests

    remote_url = "https://synapseaisolutionsa.blob.core.windows.net/public/Book-Recommendation-Dataset"
    file_list = ["Books.csv", "Ratings.csv", "Users.csv"]
    download_path = f"/lakehouse/default/{DATA_FOLDER}/raw"

    if not os.path.exists("/lakehouse/default"):
        raise FileNotFoundError(
            "Default lakehouse not found, please add a lakehouse and restart the session."
        )
    os.makedirs(download_path, exist_ok=True)
    for fname in file_list:
        if not os.path.exists(f"{download_path}/{fname}"):
            r = requests.get(f"{remote_url}/{fname}", timeout=30)
            with open(f"{download_path}/{fname}", "wb") as f:
                f.write(r.content)
    print("Downloaded demo data files into lakehouse.")
ตั้งค่าการติดตามการทดสอบ MLflow
ใช้รหัสนี้เพื่อตั้งค่าการติดตามการทดลอง MLflow ตัวอย่างนี้ปิดใช้งานการล็อกอัตโนมัติ สําหรับข้อมูลเพิ่มเติม ให้ดูบทความ Autologging ใน Microsoft Fabric
# Set up MLflow for experiment tracking
import mlflow

mlflow.set_experiment(EXPERIMENT_NAME)
mlflow.autolog(disable=True)  # Disable MLflow autologging
อ่านข้อมูลจากเลคเฮ้าส์
หลังจากใส่ข้อมูลที่ถูกต้องในเลคเฮ้าส์แล้ว ให้อ่านชุดข้อมูลทั้งสามชุดเป็น Spark DataFrames ที่แยกต่างหากในสมุดบันทึก พาธของไฟล์ในโค้ดนี้ใช้พารามิเตอร์ที่กําหนดไว้ก่อนหน้านี้
df_items = (
    spark.read.option("header", True)
    .option("inferSchema", True)
    .csv(f"{DATA_FOLDER}/raw/{ITEMS_FILE}")
    .cache()
)

df_ratings = (
    spark.read.option("header", True)
    .option("inferSchema", True)
    .csv(f"{DATA_FOLDER}/raw/{RATINGS_FILE}")
    .cache()
)

df_users = (
    spark.read.option("header", True)
    .option("inferSchema", True)
    .csv(f"{DATA_FOLDER}/raw/{USERS_FILE}")
    .cache()
)
ขั้นตอนที่ 2: ดําเนินการวิเคราะห์ข้อมูลเชิงสํารวจ
แสดงข้อมูลดิบ
สํารวจ DataFrames ด้วยคําสั่ง display ด้วยคําสั่งนี้ คุณสามารถดูสถิติ DataFrame ระดับสูง และทําความเข้าใจว่าคอลัมน์ชุดข้อมูลที่แตกต่างกันเกี่ยวข้องกันอย่างไร ก่อนที่คุณจะสํารวจชุดข้อมูล ให้ใช้โค้ดนี้เพื่อนําเข้าไลบรารีที่จําเป็น:
import pyspark.sql.functions as F
from pyspark.ml.feature import StringIndexer
import matplotlib.pyplot as plt
import seaborn as sns
color = sns.color_palette()  # Adjusting plotting style
import pandas as pd  # DataFrames
ใช้รหัสนี้เพื่อดู DataFrame ที่ประกอบด้วยข้อมูลหนังสือ:
display(df_items, summary=True)
เพิ่มคอลัมน์ _item_id สําหรับการใช้งานในภายหลัง ค่า _item_id ต้องเป็นจํานวนเต็มสําหรับแบบจําลองคําแนะนํา รหัสนี้ใช้ StringIndexer ในการแปลง ITEM_ID_COL เป็นดัชนี:
df_items = (
    StringIndexer(inputCol=ITEM_ID_COL, outputCol="_item_id")
    .setHandleInvalid("skip")
    .fit(df_items)
    .transform(df_items)
    .withColumn("_item_id", F.col("_item_id").cast("int"))
)
แสดง DataFrame และตรวจสอบว่าค่า _item_id เพิ่มขึ้นตามชื่อจริงและตามที่คาดไว้หรือไม่:
display(df_items.sort(F.col("_item_id").desc()))
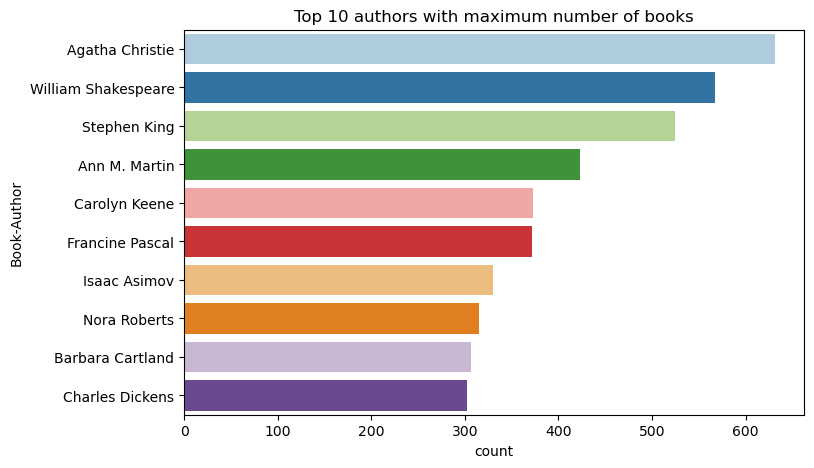
ใช้รหัสนี้เพื่อลงจุดผู้เขียน 10 อันดับแรกตามจํานวนหนังสือที่เขียนจากมากไปหาน้อย อากาธา คริสตี้ เป็นผู้เขียนชั้นนําที่มีหนังสือมากกว่า 600 เล่ม ตามด้วยวิลเลียม เชคสเปียร์
df_books = df_items.toPandas() # Create a pandas DataFrame from the Spark DataFrame for visualization
plt.figure(figsize=(8,5))
sns.countplot(y="Book-Author",palette = 'Paired', data=df_books,order=df_books['Book-Author'].value_counts().index[0:10])
plt.title("Top 10 authors with maximum number of books")

ถัดไป แสดง DataFrame ที่ประกอบด้วยข้อมูลผู้ใช้:
display(df_users, summary=True)
ถ้าแถวมีค่า User-ID หายไป ให้วางแถวนั้น ค่าที่ขาดหายไปในชุดข้อมูลแบบกําหนดเองไม่ก่อให้เกิดปัญหา
df_users = df_users.dropna(subset=(USER_ID_COL))
display(df_users, summary=True)
เพิ่มคอลัมน์ _user_id สําหรับการใช้งานในภายหลัง สําหรับแบบจําลองคําแนะนํา ค่า _user_id ต้องเป็นจํานวนเต็ม ตัวอย่างรหัสต่อไปนี้ใช้ StringIndexer ในการแปลง USER_ID_COL เป็นดัชนี
ชุดข้อมูลหนังสือมีคอลัมน์ User-ID จํานวนเต็มแล้ว อย่างไรก็ตาม การเพิ่มคอลัมน์ _user_id สําหรับความเข้ากันได้กับชุดข้อมูลที่แตกต่างกันทําให้ตัวอย่างนี้มีเสถียรภาพมากขึ้น ใช้รหัสนี้เพื่อเพิ่มคอลัมน์ _user_id:
df_users = (
    StringIndexer(inputCol=USER_ID_COL, outputCol="_user_id")
    .setHandleInvalid("skip")
    .fit(df_users)
    .transform(df_users)
    .withColumn("_user_id", F.col("_user_id").cast("int"))
)
display(df_users.sort(F.col("_user_id").desc()))
ใช้รหัสนี้เพื่อดูข้อมูลการจัดอันดับ:
display(df_ratings, summary=True)
รับการจัดอันดับที่แตกต่างกันและบันทึกไว้ใช้ในภายหลังในรายการที่ชื่อ ratings:
ratings = [i[0] for i in df_ratings.select(RATING_COL).distinct().collect()]
print(ratings)
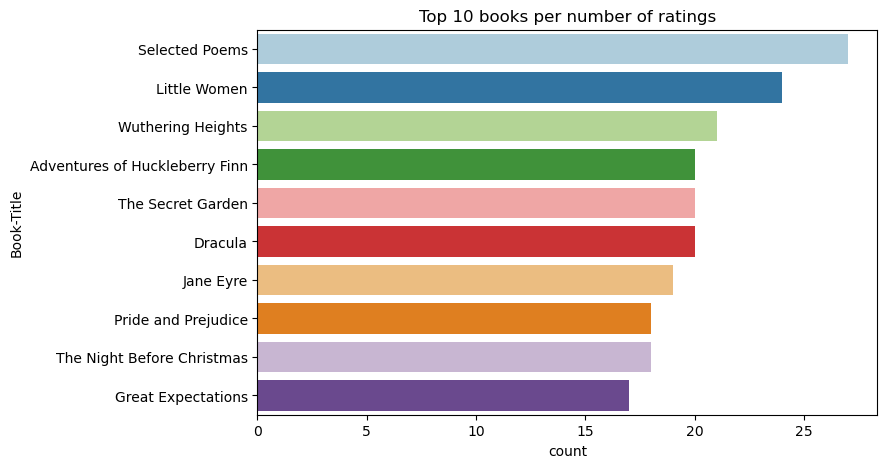
ใช้รหัสนี้เพื่อแสดงหนังสือ 10 อันดับแรกที่มีการจัดอันดับสูงสุด:
plt.figure(figsize=(8,5))
sns.countplot(y="Book-Title",palette = 'Paired',data= df_books, order=df_books['Book-Title'].value_counts().index[0:10])
plt.title("Top 10 books per number of ratings")
ตามการจัดอันดับ กวีที่เลือก เป็นหนังสือที่ได้รับความนิยมมากที่สุด ผจญภัยของ Huckleberry Finn, The Secret Garden, และ Dracula ให้คะแนนเดียวกัน

ผสานข้อมูล
ผสาน DataFrame สามรายการเป็น DataFrame หนึ่งรายการสําหรับการวิเคราะห์ที่ครอบคลุมมากขึ้น:
df_all = df_ratings.join(df_users, USER_ID_COL, "inner").join(
    df_items, ITEM_ID_COL, "inner"
)
df_all_columns = [
    c for c in df_all.columns if c not in ["_user_id", "_item_id", RATING_COL]
]

# Reorder the columns to ensure that _user_id, _item_id, and Book-Rating are the first three columns
df_all = (
    df_all.select(["_user_id", "_item_id", RATING_COL] + df_all_columns)
    .withColumn("id", F.monotonically_increasing_id())
    .cache()
)

display(df_all)
ใช้รหัสนี้เพื่อแสดงจํานวนผู้ใช้ หนังสือ และการโต้ตอบที่แตกต่างกัน:
print(f"Total Users: {df_users.select('_user_id').distinct().count()}")
print(f"Total Items: {df_items.select('_item_id').distinct().count()}")
print(f"Total User-Item Interactions: {df_all.count()}")
คํานวณและลงจุดรายการที่ได้รับความนิยมมากที่สุด
ใช้รหัสนี้เพื่อคํานวณและแสดง 10 หนังสือยอดนิยม:
# Compute top popular products
df_top_items = (
    df_all.groupby(["_item_id"])
    .count()
    .join(df_items, "_item_id", "inner")
    .sort(["count"], ascending=[0])
)

# Find top <topn> popular items
topn = 10
pd_top_items = df_top_items.limit(topn).toPandas()
pd_top_items.head(10)
ปลาย
ใช้ค่า
# Plot top <topn> items
f, ax = plt.subplots(figsize=(10, 5))
plt.xticks(rotation="vertical")
sns.barplot(y=ITEM_INFO_COL, x="count", data=pd_top_items)
ax.tick_params(axis='x', rotation=45)
plt.xlabel("Number of Ratings for the Item")
plt.show()
เตรียมการฝึกอบรมและทดสอบชุดข้อมูล
เมทริกซ์ ALS จําเป็นต้องมีการเตรียมข้อมูลบางอย่างก่อนการฝึก ใช้ตัวอย่างรหัสนี้เพื่อเตรียมข้อมูล โค้ดจะดําเนินการเหล่านี้:
- แคสต์คอลัมน์การจัดอันดับเป็นชนิดที่ถูกต้อง
- ตัวอย่างข้อมูลการทดสอบการใช้งานที่มีการให้คะแนนโดยผู้ใช้
- แยกข้อมูลลงในชุดข้อมูลการฝึกอบรมและการทดสอบ
if IS_SAMPLE:
    # Must sort by '_user_id' before performing limit to ensure that ALS works normally
    # If training and test datasets have no common _user_id, ALS will fail
    df_all = df_all.sort("_user_id").limit(SAMPLE_ROWS)

# Cast the column into the correct type
df_all = df_all.withColumn(RATING_COL, F.col(RATING_COL).cast("float"))

# Using a fraction between 0 and 1 returns the approximate size of the dataset; for example, 0.8 means 80% of the dataset
# Rating = 0 means the user didn't rate the item, so it can't be used for training
# We use the 80% of the dataset with rating > 0 as the training dataset
fractions_train = {0: 0}
fractions_test = {0: 0}
for i in ratings:
    if i == 0:
        continue
    fractions_train[i] = 0.8
    fractions_test[i] = 1
# Training dataset
train = df_all.sampleBy(RATING_COL, fractions=fractions_train)

# Join with leftanti will select all rows from df_all with rating > 0 and not in the training dataset; for example, the remaining 20% of the dataset
# test dataset
test = df_all.join(train, on="id", how="leftanti").sampleBy(
    RATING_COL, fractions=fractions_test
)
ความแปรปรวนหมายถึงข้อมูลคําติชมที่กระเพื่อมซึ่งไม่สามารถระบุความคล้ายคลึงกันในความสนใจของผู้ใช้ได้ เพื่อให้เข้าใจทั้งข้อมูลและปัญหาปัจจุบันได้ดียิ่งขึ้น ให้ใช้รหัสนี้เพื่อคํานวณความห่างของชุดข้อมูล:
# Compute the sparsity of the dataset
def get_mat_sparsity(ratings):
    # Count the total number of ratings in the dataset - used as numerator
    count_nonzero = ratings.select(RATING_COL).count()
    print(f"Number of rows: {count_nonzero}")

    # Count the total number of distinct user_id and distinct product_id - used as denominator
    total_elements = (
        ratings.select("_user_id").distinct().count()
        * ratings.select("_item_id").distinct().count()
    )

    # Calculate the sparsity by dividing the numerator by the denominator
    sparsity = (1.0 - (count_nonzero * 1.0) / total_elements) * 100
    print("The ratings DataFrame is ", "%.4f" % sparsity + "% sparse.")

get_mat_sparsity(df_all)
# Check the ID range
# ALS supports only values in the integer range
print(f"max user_id: {df_all.agg({'_user_id': 'max'}).collect()[0][0]}")
print(f"max user_id: {df_all.agg({'_item_id': 'max'}).collect()[0][0]}")
ขั้นตอนที่ 3: พัฒนาและฝึกแบบจําลอง
ฝึกแบบจําลอง ALS เพื่อให้คําแนะนําส่วนบุคคลแก่ผู้ใช้
กําหนดแบบจําลอง
Spark ML มี API ที่สะดวกสําหรับการสร้างแบบจําลอง ALS อย่างไรก็ตาม แบบจําลองจะไม่จัดการกับปัญหาอย่างเช่นความสั้นของข้อมูลและการเริ่มต้นที่เย็น (ทําคําแนะนําเมื่อผู้ใช้หรือรายการใหม่) เพื่อปรับปรุงประสิทธิภาพของแบบจําลอง ให้รวมการปรับแต่งการตรวจสอบข้ามและ hyperparameter อัตโนมัติ
ใช้โค้ดนี้เพื่อนําเข้าไลบรารีที่จําเป็นสําหรับการฝึกอบรมและการประเมินผลแบบจําลอง:
# Import Spark required libraries
from pyspark.ml.evaluation import RegressionEvaluator
from pyspark.ml.recommendation import ALS
from pyspark.ml.tuning import ParamGridBuilder, CrossValidator, TrainValidationSplit

# Specify the training parameters
num_epochs = 1  # Number of epochs; here we use 1 to reduce the training time
rank_size_list = [64]  # The values of rank in ALS for tuning
reg_param_list = [0.01, 0.1]  # The values of regParam in ALS for tuning
model_tuning_method = "TrainValidationSplit"  # TrainValidationSplit or CrossValidator
# Build the recommendation model by using ALS on the training data
# We set the cold start strategy to 'drop' to ensure that we don't get NaN evaluation metrics
als = ALS(
    maxIter=num_epochs,
    userCol="_user_id",
    itemCol="_item_id",
    ratingCol=RATING_COL,
    coldStartStrategy="drop",
    implicitPrefs=False,
    nonnegative=True,
)
ปรับแต่งแบบจําลอง hyperparameters
ตัวอย่างรหัสถัดไปสร้างเส้นตารางพารามิเตอร์เพื่อช่วยในการค้นหา hyperparameters นอกจากนี้โค้ดยังสร้างตัวประเมินการถดถอยที่ใช้ข้อผิดพลาด root-mean-square (RMSE) เป็นเมตริกการประเมิน:
#  Construct a grid search to select the best values for the training parameters
param_grid = (
    ParamGridBuilder()
    .addGrid(als.rank, rank_size_list)
    .addGrid(als.regParam, reg_param_list)
    .build()
)

print("Number of models to be tested: ", len(param_grid))

# Define the evaluator and set the loss function to the RMSE
evaluator = RegressionEvaluator(
    metricName="rmse", labelCol=RATING_COL, predictionCol="prediction"
)
ตัวอย่างโค้ดถัดไปเริ่มต้นวิธีการปรับแต่งแบบจําลองที่แตกต่างกันตามพารามิเตอร์ที่กําหนดไว้ล่วงหน้า สําหรับข้อมูลเพิ่มเติมเกี่ยวกับการปรับแบบจําลอง ดูที่การปรับแต่ง ML: การเลือกแบบจําลองและการปรับแต่ง hyperparameter ที่เว็บไซต์ Apache Spark
# Build cross-validation by using CrossValidator and TrainValidationSplit
if model_tuning_method == "CrossValidator":
    tuner = CrossValidator(
        estimator=als,
        estimatorParamMaps=param_grid,
        evaluator=evaluator,
        numFolds=5,
        collectSubModels=True,
    )
elif model_tuning_method == "TrainValidationSplit":
    tuner = TrainValidationSplit(
        estimator=als,
        estimatorParamMaps=param_grid,
        evaluator=evaluator,
        # 80% of the training data will be used for training; 20% for validation
        trainRatio=0.8,
        collectSubModels=True,
    )
else:
    raise ValueError(f"Unknown model_tuning_method: {model_tuning_method}")
ประเมินแบบจําลอง
คุณควรประเมินโมดูลกับข้อมูลทดสอบ แบบจําลองที่ได้รับการฝึกมาอย่างดีควรมีเมตริกสูงบนชุดข้อมูล
แบบจําลองที่มากเกินไปอาจจําเป็นต้องเพิ่มขนาดของข้อมูลการฝึกหรือการลดคุณลักษณะที่ซ้ําซ้อนบางอย่าง สถาปัตยกรรมแบบจําลองอาจจําเป็นต้องเปลี่ยน หรือพารามิเตอร์อาจต้องมีการปรับแต่งที่ดีบางอย่าง
โน้ต
ค่าเมตริก R สแควร์ลบแสดงว่าแบบจําลองที่ได้รับการฝึกทํางานแย่กว่าเส้นตรงแนวนอน การค้นพบนี้ชี้ให้เห็นว่าแบบจําลองที่ได้รับการฝึกไม่ได้อธิบายข้อมูล
หากต้องการกําหนดฟังก์ชันการประเมิน ให้ใช้รหัสนี้:
def evaluate(model, data, verbose=0):
    """
    Evaluate the model by computing rmse, mae, r2, and variance over the data.
    """

    predictions = model.transform(data).withColumn(
        "prediction", F.col("prediction").cast("double")
    )

    if verbose > 1:
        # Show 10 predictions
        predictions.select("_user_id", "_item_id", RATING_COL, "prediction").limit(
            10
        ).show()

    # Initialize the regression evaluator
    evaluator = RegressionEvaluator(predictionCol="prediction", labelCol=RATING_COL)

    _evaluator = lambda metric: evaluator.setMetricName(metric).evaluate(predictions)
    rmse = _evaluator("rmse")
    mae = _evaluator("mae")
    r2 = _evaluator("r2")
    var = _evaluator("var")

    if verbose > 0:
        print(f"RMSE score = {rmse}")
        print(f"MAE score = {mae}")
        print(f"R2 score = {r2}")
        print(f"Explained variance = {var}")

    return predictions, (rmse, mae, r2, var)
ติดตามการทดลองโดยใช้ MLflow
ใช้ MLflow เพื่อติดตามการทดลองทั้งหมดและบันทึกพารามิเตอร์ เมตริก และแบบจําลอง หากต้องการเริ่มการฝึกและการประเมินผลแบบจําลอง ให้ใช้โค้ดนี้:
from mlflow.models.signature import infer_signature

with mlflow.start_run(run_name="als"):
    # Train models
    models = tuner.fit(train)
    best_metrics = {"RMSE": 10e6, "MAE": 10e6, "R2": 0, "Explained variance": 0}
    best_index = 0
    # Evaluate models
    # Log models, metrics, and parameters
    for idx, model in enumerate(models.subModels):
        with mlflow.start_run(nested=True, run_name=f"als_{idx}") as run:
            print("\nEvaluating on test data:")
            print(f"subModel No. {idx + 1}")
            predictions, (rmse, mae, r2, var) = evaluate(model, test, verbose=1)

            signature = infer_signature(
                train.select(["_user_id", "_item_id"]),
                predictions.select(["_user_id", "_item_id", "prediction"]),
            )
            print("log model:")
            mlflow.spark.log_model(
                model,
                f"{EXPERIMENT_NAME}-alsmodel",
                signature=signature,
                registered_model_name=f"{EXPERIMENT_NAME}-alsmodel",
                dfs_tmpdir="Files/spark",
            )
            print("log metrics:")
            current_metric = {
                "RMSE": rmse,
                "MAE": mae,
                "R2": r2,
                "Explained variance": var,
            }
            mlflow.log_metrics(current_metric)
            if rmse < best_metrics["RMSE"]:
                best_metrics = current_metric
                best_index = idx

            print("log parameters:")
            mlflow.log_params(
                {
                    "subModel_idx": idx,
                    "num_epochs": num_epochs,
                    "rank_size_list": rank_size_list,
                    "reg_param_list": reg_param_list,
                    "model_tuning_method": model_tuning_method,
                    "DATA_FOLDER": DATA_FOLDER,
                }
            )
    # Log the best model and related metrics and parameters to the parent run
    mlflow.spark.log_model(
        models.subModels[best_index],
        f"{EXPERIMENT_NAME}-alsmodel",
        signature=signature,
        registered_model_name=f"{EXPERIMENT_NAME}-alsmodel",
        dfs_tmpdir="Files/spark",
    )
    mlflow.log_metrics(best_metrics)
    mlflow.log_params(
        {
            "subModel_idx": idx,
            "num_epochs": num_epochs,
            "rank_size_list": rank_size_list,
            "reg_param_list": reg_param_list,
            "model_tuning_method": model_tuning_method,
            "DATA_FOLDER": DATA_FOLDER,
        }
    )
เลือกการทดลองที่ชื่อว่า aisample-recommendation จากพื้นที่ทํางานของคุณเพื่อดูข้อมูลการบันทึกสําหรับการเรียกใช้การฝึกอบรม หากคุณเปลี่ยนชื่อการทดสอบ ให้เลือกการทดสอบที่มีชื่อใหม่ ข้อมูลบันทึกจะคล้ายกับรูปภาพนี้:
ขั้นตอนที่ 4: โหลดแบบจําลองสุดท้ายสําหรับการให้คะแนนและทําการคาดการณ์
หลังจากที่คุณเสร็จสิ้นการฝึกแบบจําลองแล้วเลือกแบบจําลองที่ดีที่สุดให้โหลดแบบจําลองสําหรับการให้คะแนน (บางครั้งเรียกว่าการอนุมาน) รหัสนี้จะโหลดแบบจําลองและใช้การคาดการณ์เพื่อแนะนําหนังสือ 10 อันดับแรกสําหรับผู้ใช้แต่ละราย:
# Load the best model
# MLflow uses PipelineModel to wrap the original model, so we extract the original ALSModel from the stages
model_uri = f"models:/{EXPERIMENT_NAME}-alsmodel/1"
loaded_model = mlflow.spark.load_model(model_uri, dfs_tmpdir="Files/spark").stages[-1]

# Generate top 10 book recommendations for each user
userRecs = loaded_model.recommendForAllUsers(10)

# Represent the recommendations in an interpretable format
userRecs = (
    userRecs.withColumn("rec_exp", F.explode("recommendations"))
    .select("_user_id", F.col("rec_exp._item_id"), F.col("rec_exp.rating"))
    .join(df_items.select(["_item_id", "Book-Title"]), on="_item_id")
)
userRecs.limit(10).show()
ผลลัพธ์จะคล้ายกับตารางนี้:
| _item_id | _user_id | การประเมิน | Book-Title |
|---|---|---|---|
| 44865 | 7 | 7.9996786 | Lasher: ชีวิตของ ... |
| 786 | 7 | 6.2255826 | ดีเจของเปียโนแมน |
| 45330 | 7 | 4.980466 | รัฐแห่งจิตใจ |
| 38960 | 7 | 4.980466 | สิ่งที่เขาต้องการ |
| 125415 | 7 | 4.505084 | ฮาร์รี่พอตเตอร์และ... |
| 44939 | 7 | 4.3579073 | Taltos: ชีวิตของ ... |
| 175247 | 7 | 4.3579073 | The Bonesetter's ... |
| 170183 | 7 | 4.228735 | อยู่อย่างง่ายๆ... |
| 88503 | 7 | 4.221206 | เกาะบลู... |
| 32894 | 7 | 3.9031885 | เหมายัน |
บันทึกการคาดการณ์ไปยังเลคเฮ้าส์
ใช้โค้ดนี้เพื่อเขียนคําแนะนํากลับไปยังเลคเฮ้าส์:
# Code to save userRecs into the lakehouse
userRecs.write.format("delta").mode("overwrite").save(
    f"{DATA_FOLDER}/predictions/userRecs"
)
เนื้อหาที่เกี่ยวข้อง
- ฝึกและประเมินแบบจําลองการจัดประเภทแบบข้อความ
- แบบจําลองการเรียนรู้ของเครื่อง ใน Microsoft Fabric
- แบบจําลองการเรียนรู้ของเครื่อง Train
- การทดลองการเรียนรู้ของเครื่อง ใน Microsoft Fabric


