Using Frequency Analysis to Defend Office 365
As security threats evolve, so must defense. In Office 365, we have engineering teams dedicated to building intrusion detection systems that protect customer data against new and existing threats. In this blog, we are talking about a security monitoring challenge of cloud services and our recent attempt to solve it.
Let us start with two scenarios. In the first scenario, an adversary sneakily adds or updates a registry key to run his malware automatically. In the second scenario, an adversary sneakily injects a malicious DLL into a long running legitimate process to maintain a persistent backdoor. The traditional signature-based detections work well for known threats. To detect unknown threats, scheduled frequency analysis across machines is a practical approach, since it is unlikely that a malicious registry key or loaded DLL will be present on most of systems in our fleet. However, this approach usually requires collecting more monitoring data. For example, if we are capturing a daily snapshot of loaded DLLs for all running processes, we could easily log 10,000 events per machine per day. What if there are more similar detections? The data volume will stress our logging, uploading and analytics infrastructures.
To meet this challenge, we developed a "prevalence system" that enables us to identify common registry keys and DLL paths across our fleet and reduce the volume of data that must be logged. In the first part of this post, we present an initial prototype. In the following three parts, we discuss our solutions to three critical weaknesses in the initial prototype. Finally, we share some results of our experiments.
Initial Prototype
Our security agent periodically snapshots registry key values and loaded DLLs. Since most entries are the same across our fleet, we would like our agent to only log those that are unique to that machine. We call this measurement "prevalence". The system must maintain a secure, reliable, up-to-date list of prevalent entries. We call this the “prevalence web service”.
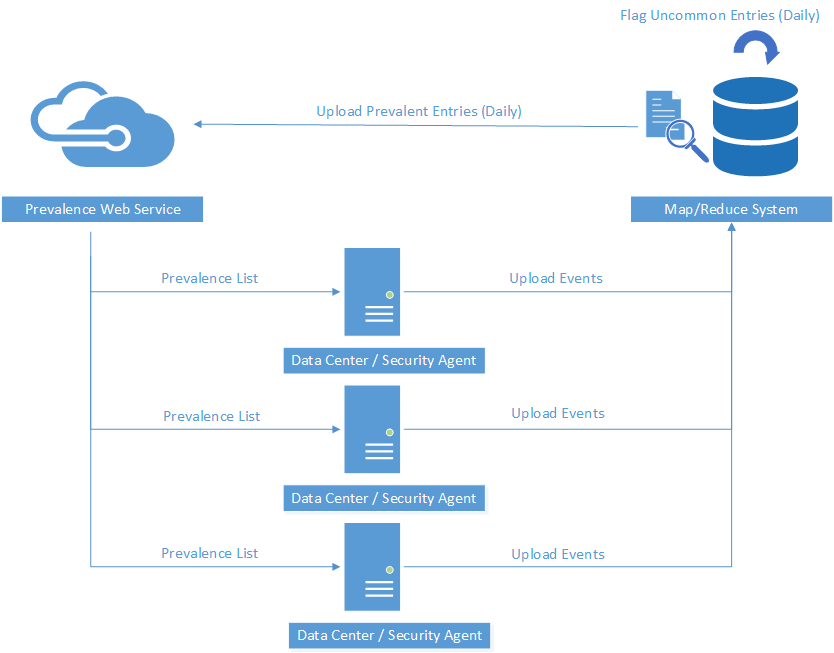
As shown in Figure 1, the initial prototype is not complicated and is comprised of three parts: prevalence web service, security monitoring agent and map/reduce system. The security agent is responsible for periodically outputting a snapshot of loaded DLLs. It calls the prevalence web service and retrieves a list of prevalent DLL paths. Next, it removes these prevalent DLL paths from the snapshot and only logs the DLL paths that are not in the list. Then those logged events are uploaded to security event hub. Map/reduce jobs determine which paths are prevalent across the fleet and which paths are uncommon. These newly-identified prevalent paths are uploaded to prevalence web service.
The overall design is trivial. But there are several critical problems to solve to ensure the system is reliable. One critical and common scenario is what to do when prevalence web service is unavailable. Another challenge with the prototype is how to maintain a relatively small prevalence list. Moreover, how to reduce detection false-positive is also important.
Round-Robin Logging
There are many reasons why the prevalence web service may be unavailable. For example, a network connectivity issue may prevent the service from being reached. Moreover, the prevalence web service might be under upgrade and be unavailable for all clients.
When the prevalence web service is unavailable, the agent could choose to log every entry (treating all of them as anomalous) or log no entries (treating all of them as prevalent). If we simply skip logging all snapshot events, then we lose coverage for that detection. The goal is to find a balance between resources and detection coverage. We implemented a consistent round-robin approach for event logging when prevalence is unavailable.
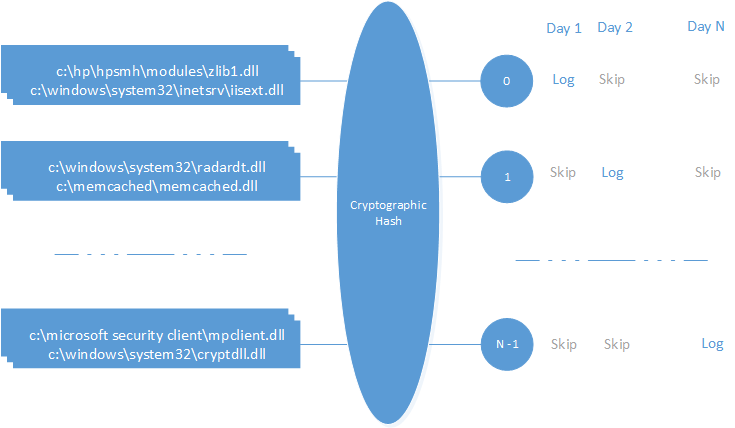
Suppose we have 1600 different loaded DLLs for all running processes in machine A. We would like to split these events into 16 buckets where every bucket has 100 events. Bucket 0 will be logged in day 1; bucket 1 will be logged in day 2 …; bucket 15 will be logged in day 16. One cycle completes in 16 days. A given entry will be logged exactly once in a 16-day cycle.
The event-bucket mapping algorithm needs to be consistent. First, it must map the events uniformly into different buckets. We could use the .NET GetHashCode() method to uniformly hash DLL paths. However, this hash code is not guaranteed to be unique across machines. We need an algorithm that maps the same DLL path to the same bucket on every machine. This ensures that the same DLL will be uploaded to map/reduce systems on the same day so that the frequency analysis is reliable. We chose to use a cryptographic hash since it will return the same value for a given path on every machine.
Trimming the Prevalence List
Another challenge is the size of the prevalence list. The DLL list will grow as new versions of services are deployed. Storing a growing prevalence list in prevalence server is not a problem. However, fetching an ever-growing prevalence list will lead to network and memory pressure in the security monitoring agent.
One approach is to record the current timestamp when each prevalence entry is added to the service, and design the web method to only retrieve recent entries. However, these prevalent DLL paths will not be logged once they have been uploaded to the prevalence service. They will not be identified as prevalent entries again by the map/reduce jobs in the security event hub (see Figure 1). So, their timestamps will not be updated in the prevalence web service and they will become stale finally.
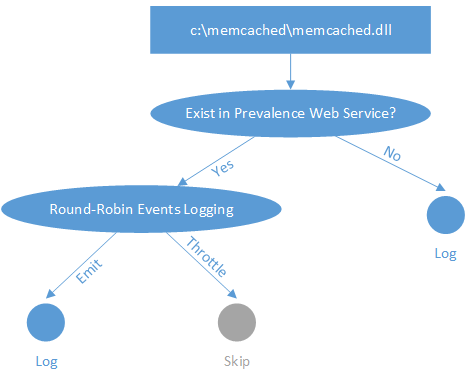
One solution is to log a subset of DLLs even if they are on the prevalence list. As shown in Figure 3, we use the round-robin event logging technique mentioned in the previous section when the DLL matches a prevalence entry. Then 1/16th of prevalence entries will be logged and uploaded to event hubs every day consistently. The timestamp of these entries in prevalence service will be updated every 16 days. Finally, we could ensure those ever-prevalent DLL paths always stay in prevalence web service with recent timestamps.
Reducing False-Positive
False-positive results can severely limit an intrusion detection system’s effectiveness. Random GUIDs and version numbers present in registry and DLL paths present a challenge for systems based on frequency analysis. One solution is to normalize registry and DLL paths by removing these portions. Another approach would be to compare against historical data and only flag those which randomly appear in history.
Reducing Event Volume
The prevalence system significantly reduces the amount of data we log for loaded DLLs and registry values. In our fleet of over 100,000 systems, this approach reduced the logging volume by 75%.
With the help of the prevalence system, we can now build high-fidelity detections for generic DLL side loading, phantom DLL hijacking and registry hijacking. The prevalence system can be applied to other scenarios where a large volume of similar events need to be captured from a large fleet of similar machines.
Conclusion
To better defend Office 365, we are constantly improving the techniques we use to identify unauthorized activities in our datacenter. This prevalence approach allows us to increase the amount of data that we analyze without overwhelming our telemetry pipeline. We are still iterating on this approach - if you have feedbacks or suggestions, we would love to hear from you.


