Real-time performance monitoring for Azure SQL Database Managed Instance
This article was co-authored by Dimitri Furman and Denzil Ribeiro
Reviewed by: Danimir Ljepava, Borko Novakovic, Jovan Popovic, Rajesh Setlem, Mike Weiner
Introduction
In our ongoing engagements with the SQL DB Managed Instance preview customers a common requirement has been to monitor database workload performance in real time. This includes not just monitoring of a single (or a few) performance metrics, but being able to look at many relevant metrics at once, within seconds of events occurring. While much of the needed performance data is available in various DMVs, consuming it via T-SQL queries and looking at the results in SSMS query windows is quite cumbersome, and does not provide a simple way to look at real time data, or at recent historical data and trends.
More than a year ago, we had similar monitoring requirements for SQL Server on Linux, and had blogged about it here: How the SQLCAT Customer Lab is Monitoring SQL on Linux. For monitoring Managed Instance, we used Telegraf. Telegraf is a general-purpose agent for collecting metrics, and is broadly adopted in the community. It can be used for monitoring SQL Server on both Windows and Linux using the SQL Server plugin. In Telegraf version 1.8.0, this plugin has been updated to support SQL DB Managed Instance as well. Telegraf connects to Managed Instance remotely, and collects performance data from DMVs. InfluxDB is the time series database for the monitoring data collected by Telegraf, while new Grafana dashboards, specific to Managed Instance, were developed to visualize this data. Big thanks to Daniel Nelson and Mark Wilkinson for accepting pull requests with the changes to the Telegraf SQL Server plugin needed to support Managed Instance.
This blog will describe a solution for real time performance monitoring of Managed Instance in sufficient detail for customers to use it for the same purpose. The code we developed is open source and is hosted in the sqlmimonitoring GitHub repo. We welcome community contributions to improve and expand this solution. Contributions to the Telegraf collector should be made via pull requests to the SQL Server Input Plugin for Telegraf. For changes to Grafana dashboards, pull requests should be made to the sqlmimonitoring GitHub repo.
The detailed discussion below is intended specifically for real time performance monitoring and troubleshooting. For other monitoring needs, such as query-level performance monitoring, historical trend investigations, and resource consumption monitoring, consider using Azure SQL Analytics. In near future, Azure Monitor will provide support for monitoring of Managed Instance metrics and sending notifications.
Dashboard examples
Before describing the solution in detail, here are a few examples of Managed Instance Grafana dashboards, captured while a customer workload is running.
Figure 1. Performance dashboard. Additional panels not shown: Memory Manager, Memory Clerks, PLE, Buffer Manager, Access Methods, SQL Statistics.
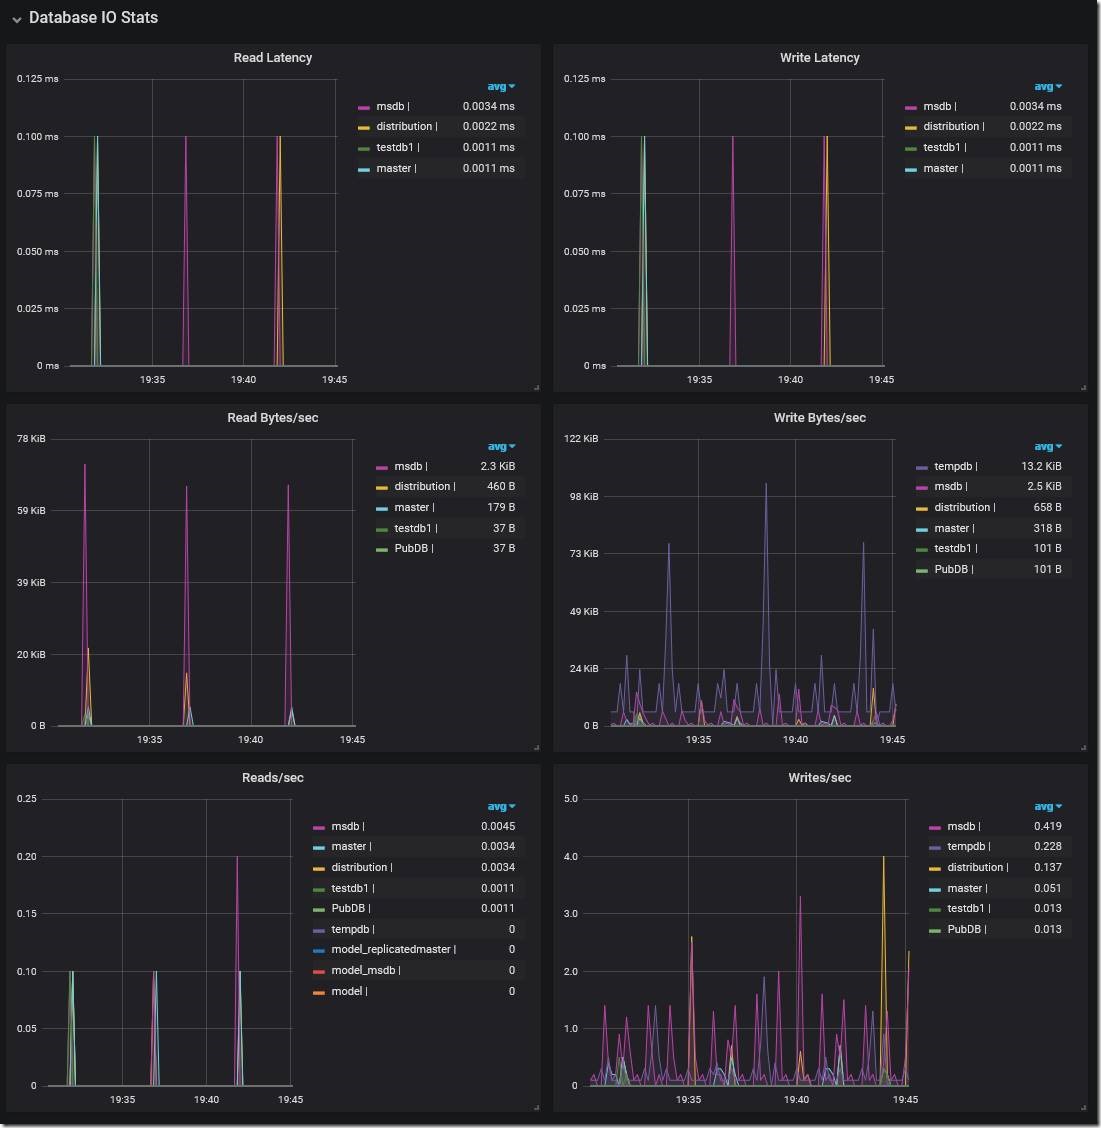
Figure 2. Database IO Stats dashboard. Additional panels not shown: Data File Size, Log File Size, Log File Used.
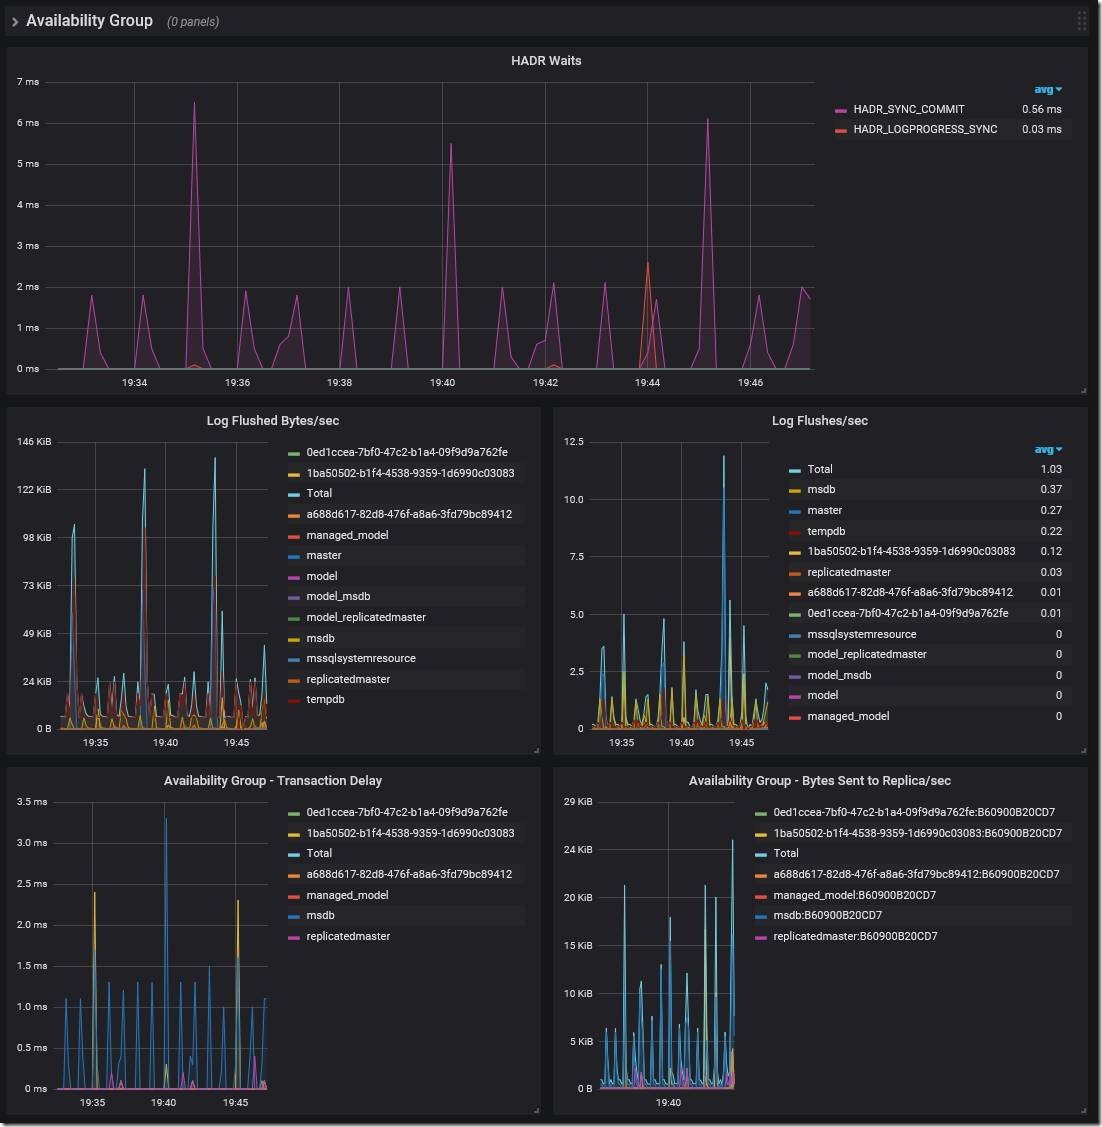
Figure 3. HADR dashboard.
Setup and configuration
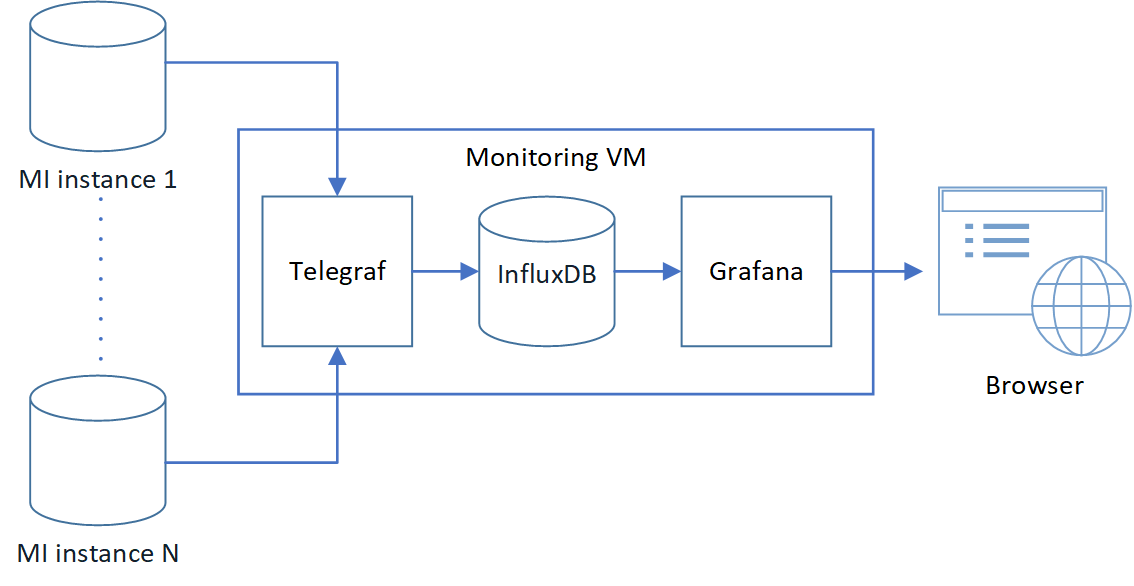
Here is the conceptual diagram of the solution. The arrows show the flow of monitoring data from source to destination. Telegraf pulls data from Managed Instances and loads it into InfluxDB. Grafana queries InfluxDB to visualize the data on web dashboards.
Prerequisites
- Basic knowledge of Linux.
- Linux VM(s) with internet connectivity, which is needed to download Docker images during initial configuration. In a typical configuration shown on the diagram, a single VM runs all three components (Telegraf, InfluxDB, and Grafana).
- Network connectivity between the Telegraf VM and monitored Managed Instances. Traffic from the Telegraf VM to the Managed Instances on TCP port 1433 must be allowed. The Telegraf VM can be in the same VNet where monitored instances are, or in a peered VNet, or on premises if the on-prem network is connected to the VNet over ExpressRoute or VPN. For details on supported Managed Instance connectivity scenarios, see this documentation article.
- Inbound traffic to the VM(s) on the following ports must be allowed. If deploying in Azure, modify NSGs accordingly.
- TCP port 8086 – this is the default InfluxDB port. This is only required on the InfluxDB VM, and only if lnfluxDB is running on a machine different from the Grafana machine.
- TCP port 3000 – this is the Grafana default web port to access the web-based dashboards. This is only required on the Grafana VM.
In our test environment, we use a single VM in the same Azure VNet as the monitored instances. If monitoring just a couple of instances, the VM can be quite small and inexpensive. A single F1 VM (1 vCore and 2 GB of memory) with one P10 (128 GB) data disk for InfluxDB was sufficient for monitoring two instances. However, what we describe is a central monitoring solution, and as such it can be used to monitor many Managed Instance and SQL Server instances. For large deployments, you will likely need to use larger VMs, and/or use a separate VM for InfluxDB. If dashboard refreshes start taking too long, then more resources for InfluxDB are needed.
Step 1
Install Git and Docker, if they are not already installed, otherwise skip this step.
Ubuntu:
sudo apt-get install git -y
wget -qO- https://get.docker.com/ | sudo sh
RHEL/CentOS:
sudo yum install git -y
sudo yum install docker -y
sudo systemctl enable docker
sudo systemctl start docker
Note: On RHEL, SELinux is enabled by default. For the InfluxDB and Grafana containers to start successfully, we either have to disable SELinux, or add the right SELinux policy. With the default RHEL configuration, SELINUX configuration is set to enforcing. Changing this configuration to permissive or disabled will work around this issue. Alternatively set the right SELinux policy as described here. See this documentation article for more information.
sudo vi /etc/selinux/config
Step 2
Clone the GitHub repo.
cd $HOME
sudo git clone https://github.com/denzilribeiro/sqlmimonitoring.git/
Step 3
Install, configure, and start InfluxDB.
a. When creating the Azure VM, we added a separate data disk for InfluxDB. Now, mount this disk as /influxdb, following the steps in this documentation article (replace datadrive with influxdb).
b. Optionally, edit the runinfluxdb.sh file and modify the INFLUXDB_HOST_DIRECTORY variable to point to the directory where you want the InfluxDB volume to be mounted, if it is something other than the default of /influxdb.
cd $HOME/sqlmimonitoring/influxdb
sudo vi runinfluxdb.sh
If you are new to vi (a text editor), use the cheat sheet.
c. Pull the InfluxDB Docker image and start InfluxDB.
cd $HOME/sqlmimonitoring/influxdb
sudo ./runinfluxdb.sh
Step 4
Pull the Grafana Docker image and start Grafana.
cd $HOME/sqlmimonitoring/grafana
sudo ./rungrafana.sh
Step 5
Optionally, if the firewall is enabled on the VM, create an exception for TCP port 3000 to allow web connections to Grafana.
Ubuntu:
sudo ufw allow 3000/tcp
sudo ufw reload
RHEL/CentOS:
sudo firewall-cmd --zone=public --add-port=3000/tcp -permanent
sudo firewall-cmd --reload
Step 6
Install Telegraf version 1.8.0 or later. Support for MI was first introduced in this version.
Ubuntu:
cd $HOME
wget https://dl.influxdata.com/telegraf/releases/telegraf_1.8.0-1_amd64.deb
sudo dpkg -i telegraf_1.8.0-1_amd64.deb
RHEL/CentOS:
cd $HOME
wget https://dl.influxdata.com/telegraf/releases/telegraf-1.8.0-1.x86_64.rpm
sudo yum localinstall telegraf-1.8.0-1.x86_64.rpm -y
Step 7
Create a login for Telegraf on each instance you want to monitor, and grant permissions. Here we create a login named telegraf, which is referenced in the Telegraf config file later.
USE master;
CREATE LOGIN telegraf WITH PASSWORD = N'MyComplexPassword1!', CHECK_POLICY = ON;
GRANT VIEW SERVER STATE TO telegraf;
GRANT VIEW ANY DEFINITION TO telegraf;
Step 8
Configure and start Telegraf.
a. The Telegraf configuration file (telegraf.conf) is included in sqlmimonitoring/telegraf, and includes the configuration settings used by the solution. Edit the file to specify your monitored instances in the [[inputs.sqlserver]] section, and then copy it to /etc/telegraf/telegraf.conf, overwriting the default configuration file.
sudo mv /etc/telegraf/telegraf.conf /etc/telegraf/telegraf_original.conf
sudo cp $HOME/sqlmimonitoring/telegraf/telegraf.conf /etc/telegraf/telegraf.conf
sudo chown root:root /etc/telegraf/telegraf.conf
sudo chmod 644 /etc/telegraf/telegraf.conf
b. Alternatively, edit the /etc/telegraf/telegraf.conf file in place. This is preferred if you would like to keep all other Telegraf settings present in the file as commented lines.
sudo vi /etc/telegraf/telegraf.conf
Uncomment every line shown below, and add a connection string for every instance/server you would like to monitor in the [[inputs.sqlserver]] section. When editing telegraf.conf in the vi editor, search for [[inputs.sqlserver]] by typing “/” followed by “inputs.sqlserver”. Ensure the URL and database name for InfluxDB in the outputs.influxdb section are correct.
[[inputs.sqlserver]]
servers = ["Server=server1.xxx.database.windows.net;User Id=telegraf;Password=MyComplexPassword1!;app name=telegraf;"
,"Server=server2.xxx.database.windows.net;User Id=telegraf;Password=MyComplexPassword1!;app name=telegraf;"]

query_version = 2

[[outputs.influxdb]]
urls = ["https://127.0.0.1:8086"]
database = "telegraf"
c. Note that the default polling interval in Telegraf is 10 seconds. If you want to change this, i.e. for more precise metrics, you will have to change the interval parameter in the [agent] section in the telegraf.conf file.
d. Once the changes are made, start the service.
sudo systemctl start telegraf
e. Confirm that Telegraf is running.
sudo systemctl status telegraf
Step 9
In Grafana, create the data source for InfluxDB, and import Managed Instance dashboards.
In this step, [GRAFANA_HOSTNAME_OR_IP_ADDRESS] refers to the public hostname or IP address of the Grafana VM, and [INFLUXDB_HOSTNAME_OR_IP_ADDRESS] refers to the hostname or IP address of the InfluxDB VM (either public or private) that is accessible from the Grafana VM. If using a single VM for all components, these values are the same.
a. Browse to your Grafana instance - https://[GRAFANA_IP_ADDRESS_OR_SERVERNAME]:3000.
Login with the default user admin with password admin. Grafana will prompt you to change the password on first login.
b. Add a data source for InfluxDB. Detailed instructions are at https://docs.grafana.org/features/datasources/influxdb/
Click “Add data source”
Name: influxdb-01
Type: InfluxDB
URL: https://[INFLUXDB_HOSTNAME_OR_IP_ADDRESS]:8086. The default of https://localhost:8086 works if Grafana and InfluxDB are on the same machine; make sure to explicitly enter this URL in the field.
Database: telegraf
Click “Save & Test”. You should see the message “Data source is working”.
c. Download Grafana dashboard JSON definitions from the repo dashboards folder for all three dashboards, and then import them into Grafana. When importing each dashboard, make sure to use the dropdown labeled InfluxDB-01 to select the data source created in the previous step.
Step 10
Optionally, configure a retention policy for data in InfluxDB. By default, monitoring data is maintained indefinitely.
a. Start InfluxDB console.
sudo docker exec -it influxdb influx
b. View current retention policies in InfluxDB.
use telegraf;
show retention policies;
c. Create a retention policy and exit InfluxDB console.
create retention policy retain30days on telegraf duration 30d replication 1 default;
quit
In this example, we created a 30-day retention policy for the telegraf database, setting it as the default policy.
Step 11
You are done! The dashboards should now display data from all instances specified in the Telegraf config file. You can switch between monitored instances using the dropdown at the top of each dashboard. You can change the time scale by using the pull-down menu in upper right. You can switch between different dashboards using the “Other Managed Instance Dashboards” button.
Troubleshooting examples
Here we will show some examples of actual troubleshooting scenarios on Managed Instance where this monitoring solution helped us identify the root cause.
A six-minute workload stall
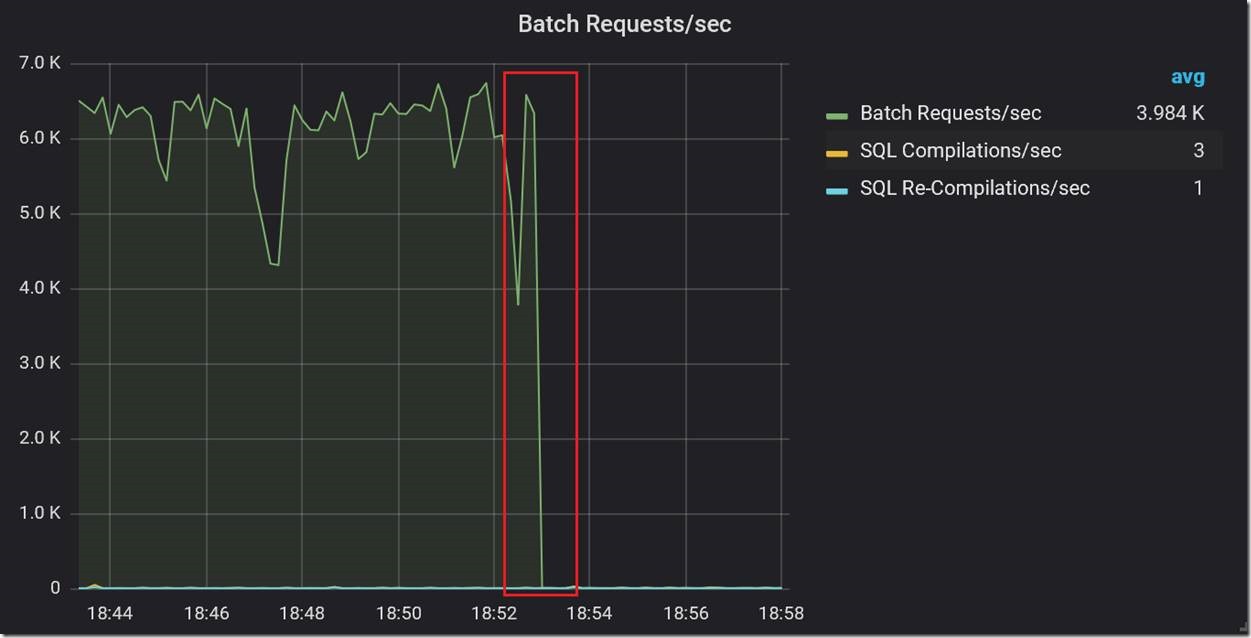
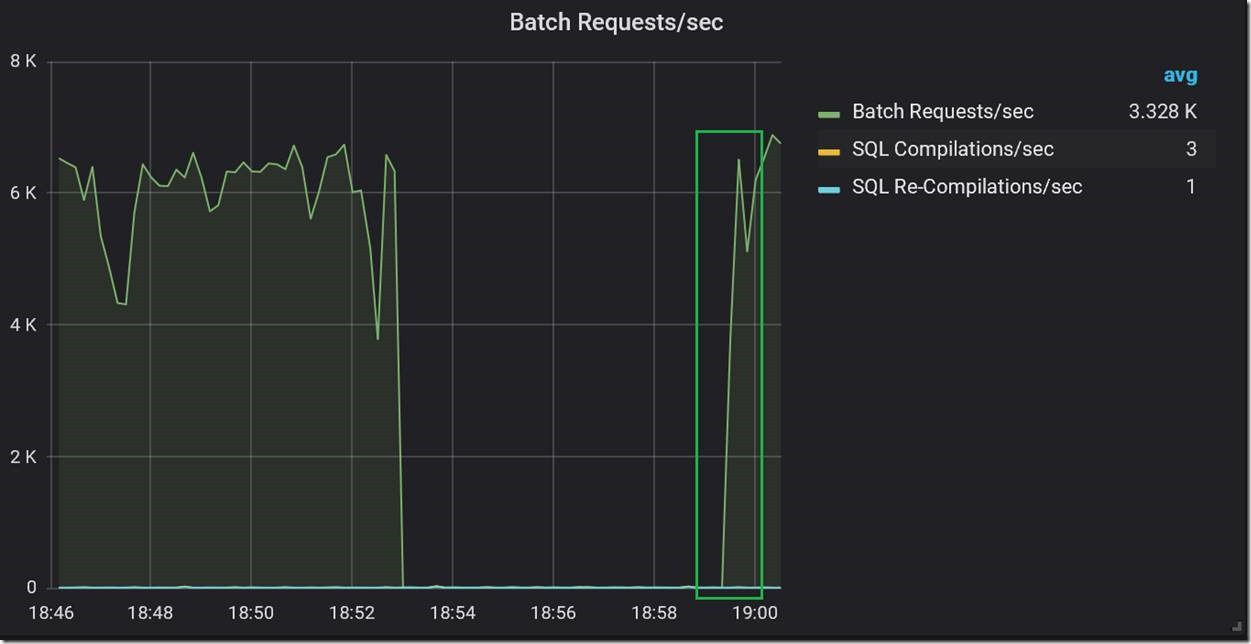
In this case, we were testing an OLTP application workload. During one test, we noticed a complete stall in workload throughput.
During the stall, we saw no current waits on the instance at all, so this was not the kind of problem where the workload was stalled because of waiting for some resource, such as disk IO or memory allocation.
Then, after about six minutes, the workload resumed at the previous rate.
Looking at the waits again, we now saw a very large spike in LCK_IX_M waits, dwarfing all other waits.
This immediately pointed to a blocking problem, which was indeed the case. As a part of each transaction, the application was inserting a row into a history table. That table was created as a heap. We found that during the stall, a single DELETE statement affecting a large number of rows in the history table was executed under the serializable transaction isolation level. Running a DML statement targeting a heap table under serializable isolation always causes lock escalation. Thus, while the DELETE query ran for six minutes, it held an X lock at the table level. This OLTP workload inserts a row into the history table as a part of each transaction, therefore it was completely blocked.
What is interesting about monitoring this kind of typical blocking scenario is that the LCK_IX_M waits did not appear on the dashboard until after the stall has ended. This is because SQL Server reports waits in sys.dm_os_wait_stats DMV only once they have completed, and none of the LCK_IX_M waits completed until the X lock went away and the workload had resumed.
Periodic drops in throughput
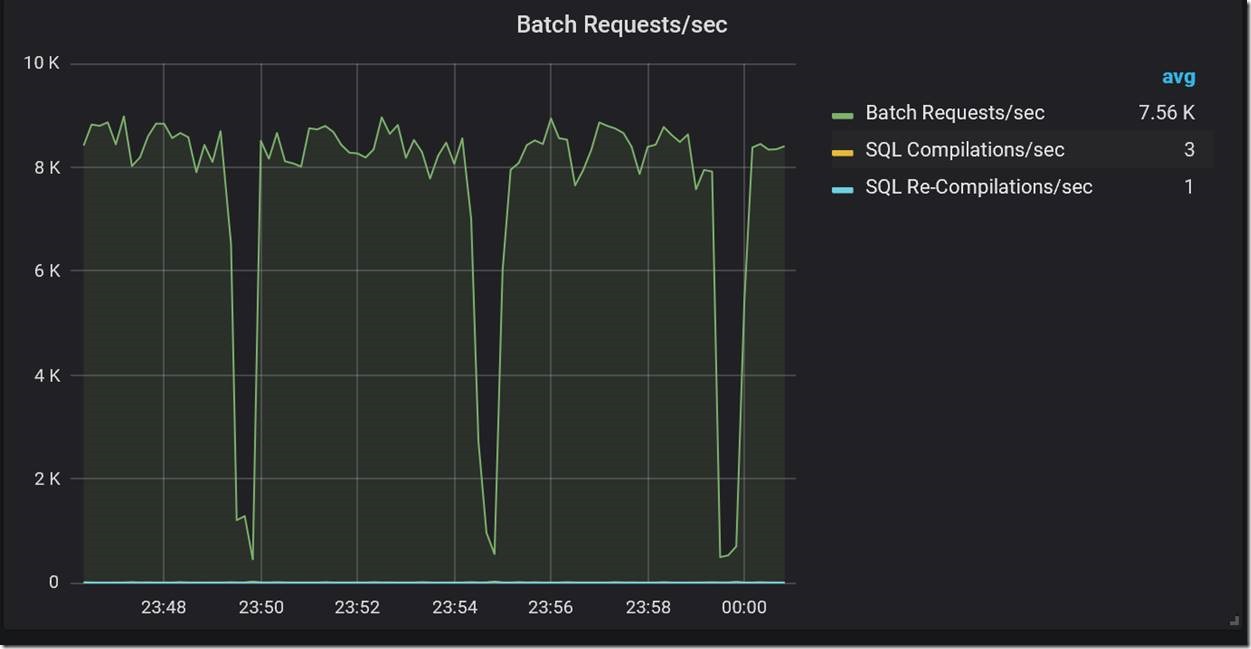
The next example is more interesting, and is specific to Managed Instance. During an otherwise steady high volume OLTP workload on a General Purpose instance, we observed sharp drops in workload throughput at five-minute intervals.
Looking at the graph of wait types, we saw corresponding spikes in BACKUPIO and WRITELOG waits, at the same five-minute intervals.
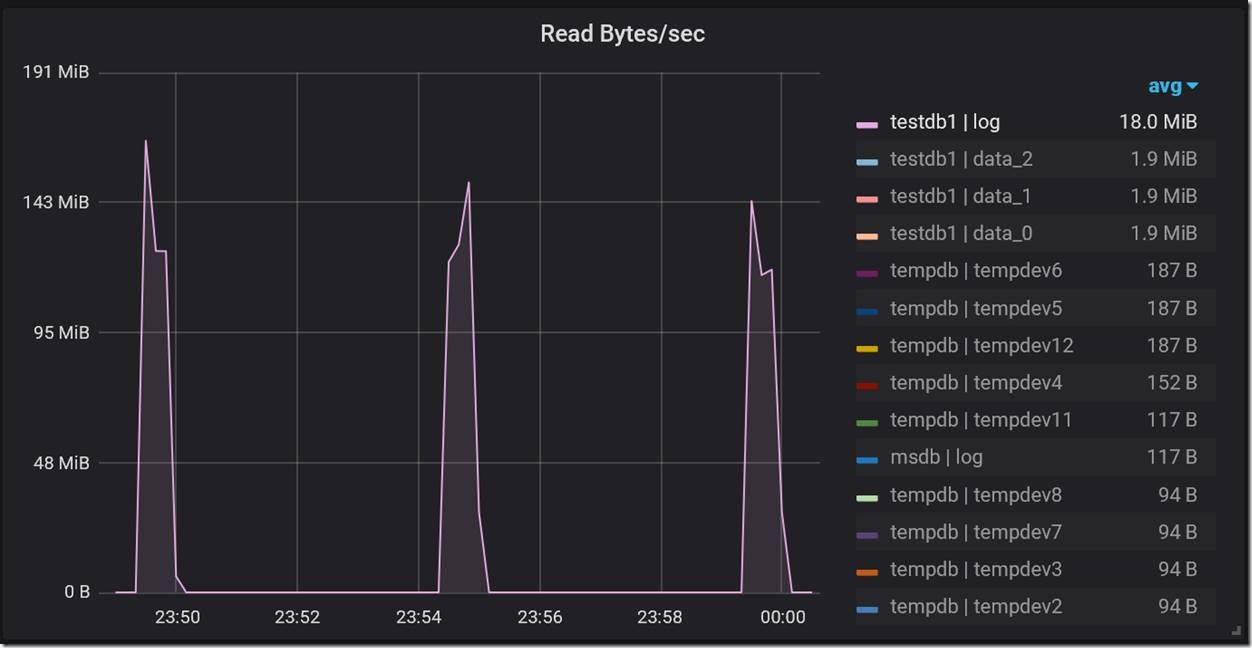
Since log backups on Managed Instance run every five minutes, this seemed to imply a strong correlation between drops in throughput and log backups. But why do log backups cause drops in throughput? Looking at the Database IO Stats dashboard, we saw corresponding five-minute spikes in Read Bytes/sec specifically for the transaction log file, which is indeed expected while a transaction log backup is running.
The magnitude of these spikes in read throughput pointed to the root cause of the problem. The spikes were close to the throughput limit of the transaction log blob. At the high level of workload throughput we were driving (~ 8K batch requests/second), the combined read and write IO against the log blob during log backup was enough to cause Azure Storage throttling. When throttling occurs, it affects both reads and writes. This made transaction log writes slower by orders of magnitude, which naturally caused major drops in workload throughput. This problem is specific to General Purpose Managed Instance with its remote storage, and does not occur on Business Critical Managed Instance. For General Purpose Managed Instance, the engineering team is looking for ways to minimize or eliminate this performance impact in a future update.
Conclusion
In this article, we describe a solution for real time performance monitoring of Azure SQL Database Managed Instance. In our customer engagements, we found it indispensable for monitoring workload performance, and for diagnosing a broad range of performance issues in customer workloads. We hope that customers using Managed Instance will find it useful for database workload monitoring and troubleshooting, as they migrate their on-premises applications to Azure. We hope many of you will start your journey with Managed Instance soon, and are looking forward to hearing about your experiences, as well as feedback and contributions to this monitoring solution.

