你当前正在访问 Microsoft Azure Global Edition 技术文档网站。 如果需要访问由世纪互联运营的 Microsoft Azure 中国技术文档网站,请访问 https://docs.azure.cn。
向地图添加多边形层
本文介绍如何使用多边形层渲染地图上的 Polygon 和 MultiPolygon 特征几何图形区域。 Azure Maps Web SDK 还支持按扩展 GeoJSON 架构中定义的方式创建 Circle 几何图形。 在地图上渲染时,这些圆将转换为多边形。 使用 atlas.Shape 类进行包装时,可轻松更新所有特征几何图形。
使用多边形层
将多边形层连接到数据源并加载到地图上时,它将渲染具有 Polygon 和 MultiPolygon 特征的区域。 要创建多边形,请将其添加到数据源,并使用多边形层通过 PolygonLayer 类对其进行渲染。
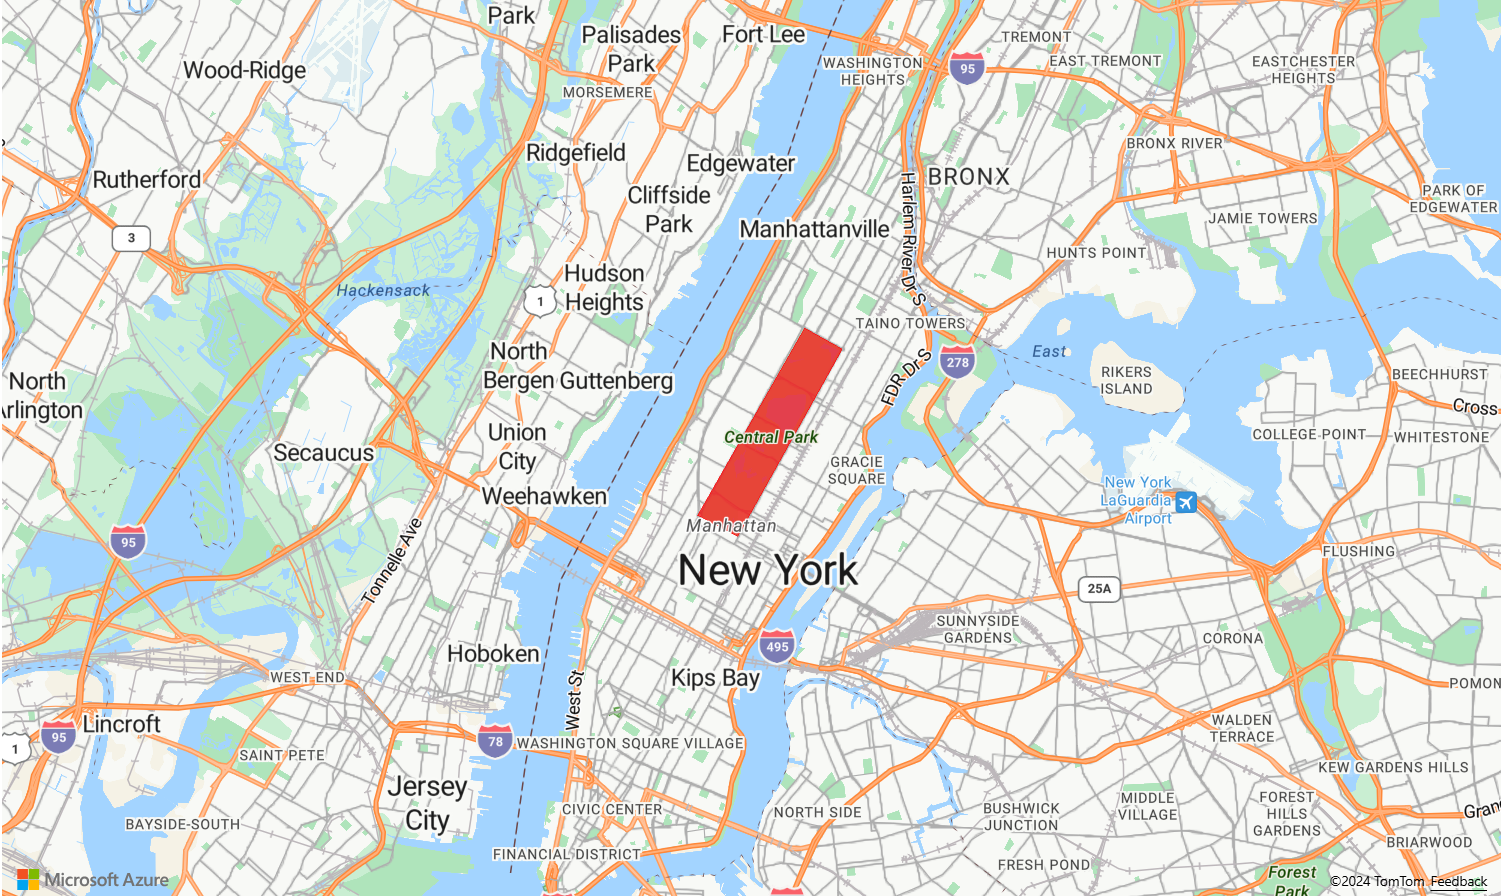
以下示例代码演示了如何创建一个使用用红色多边形覆盖纽约市中央公园的多边形图层。
function InitMap()
{
  var map = new atlas.Map('myMap', {
    center: [-73.97, 40.78],
    zoom: 11,
    view: "Auto",

    //Add authentication details for connecting to Azure Maps.
    authOptions: {
      authType: 'subscriptionKey',
      subscriptionKey: '{Your-Azure-Maps-Subscription-key}'
    }
  });

  //Wait until the map resources are ready.
  map.events.add('ready', function () {

    /*Create a data source and add it to the map*/
    var dataSource = new atlas.source.DataSource();
    map.sources.add(dataSource);

    /*Create a rectangle*/
    dataSource.add(new atlas.Shape(new atlas.data.Feature(
    new atlas.data.Polygon([[
      [-73.98235, 40.76799],
      [-73.95785, 40.80044],
      [-73.94928, 40.7968],
      [-73.97317, 40.76437],
      [-73.98235, 40.76799]
    ]])
    )));

    /*Create and add a polygon layer to render the polygon to the map*/
    map.layers.add(new atlas.layer.PolygonLayer(dataSource, null,{
    fillColor: "red",
    fillOpacity: 0.7
    }), 'labels')
  });
}
结合使用多边形和线条层
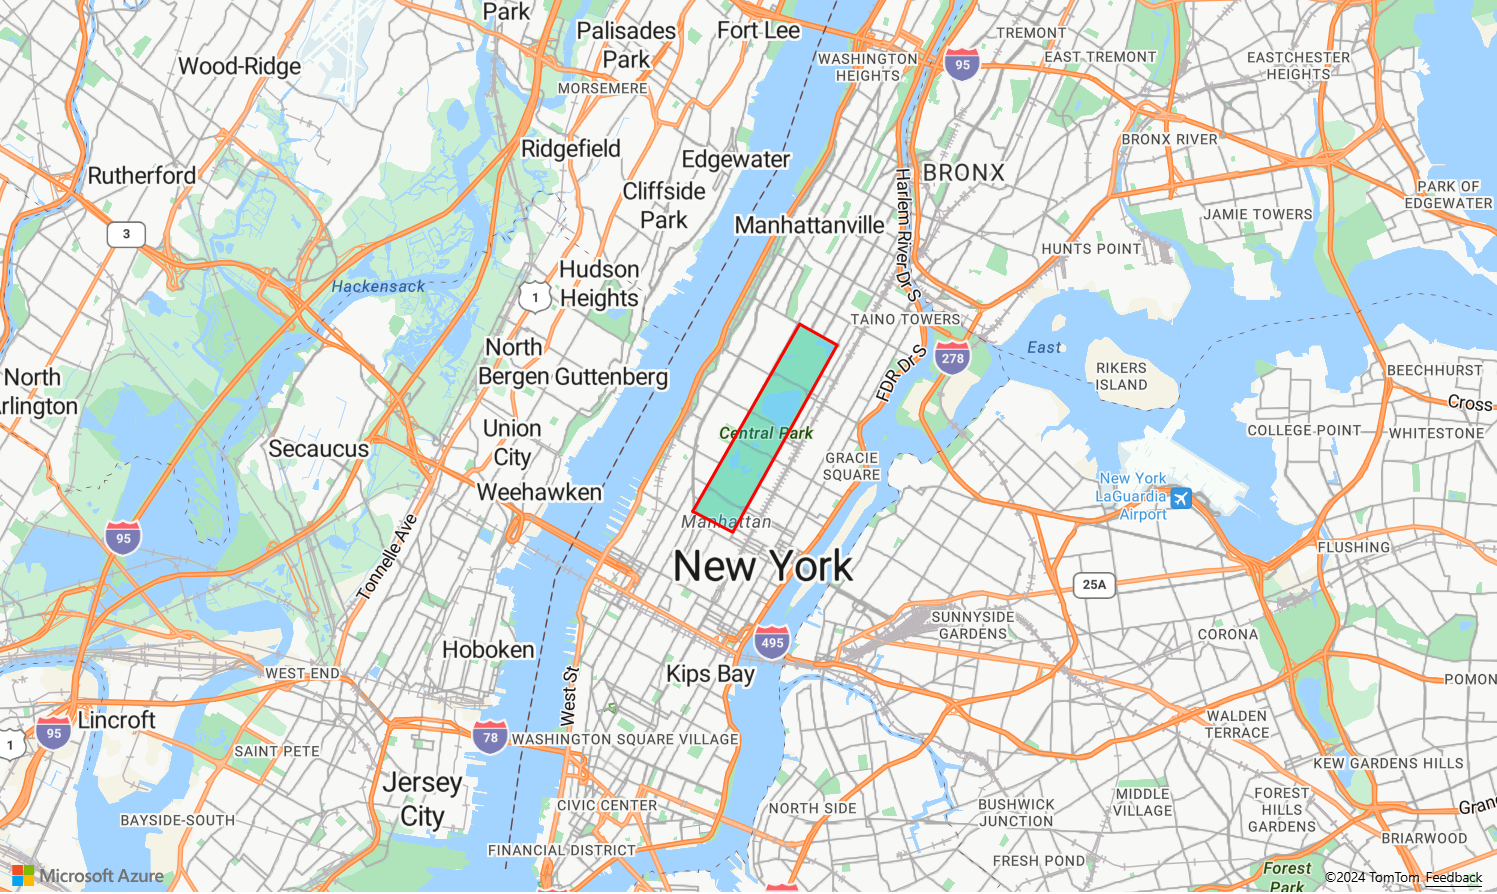
线条层用于渲染多边形的轮廓。 下面的代码示例像上一个示例一样渲染了一个多边形,但添加了一个线条层。 此线条层是连接到数据源的另一个层。
function InitMap()
{
  var map = new atlas.Map('myMap', {
    center: [-73.97, 40.78],
    zoom: 11,
    view: "Auto",

    //Add authentication details for connecting to Azure Maps.
    authOptions: {
      // Get an Azure Maps key at https://azuremaps.com/.
      authType: 'subscriptionKey',
      subscriptionKey: '{subscription key}'
    }
  });

  //Wait until the map resources are ready.
  map.events.add('ready', function () {

    /*Create a data source and add it to the map*/
    var dataSource = new atlas.source.DataSource();
    map.sources.add(dataSource);

    /*Create a rectangle*/
    dataSource.add(new atlas.data.Polygon([[
    [-73.98235, 40.76799],
    [-73.95785, 40.80045],
    [-73.94928, 40.7968],
    [-73.97317, 40.76437],
    [-73.98235, 40.76799]
    ]])
          );

    //Create a polygon layer to render the filled in area of the polygon.
    var polygonLayer = new atlas.layer.PolygonLayer(dataSource, 'myPolygonLayer', {
    fillColor: 'rgba(0, 200, 200, 0.5)'
    });

    //Create a line layer for greater control of rendering the outline of the polygon.
    var lineLayer = new atlas.layer.LineLayer(dataSource, 'myLineLayer', {
    strokeColor: 'red',
    strokeWidth: 2
    });

    /*Create and add a polygon layer to render the polygon to the map*/
    map.layers.add([polygonLayer, lineLayer])
  });
}
使用图案填充多边形
除了为多边形填充颜色之外,还可以使用图像图案来进行填充。 将图像图案加载到地图图像子画面资源中,然后使用多边形层的 fillPattern 属性引用该图像。
有关显示如何将图像模板用作多边形图层中填充模式的全功能示例,请参阅 Azure Maps 示例中的使用内置图标模板填充多边形。 如需此示例的源代码,请参阅使用内置图标模板源代码填充多边形。
提示
Azure Maps Web SDK 提供了多个可与填充图案一起使用的可自定义的图像模板。 有关详细信息,请参阅如何使用图像模板文档。
自定义多边形层
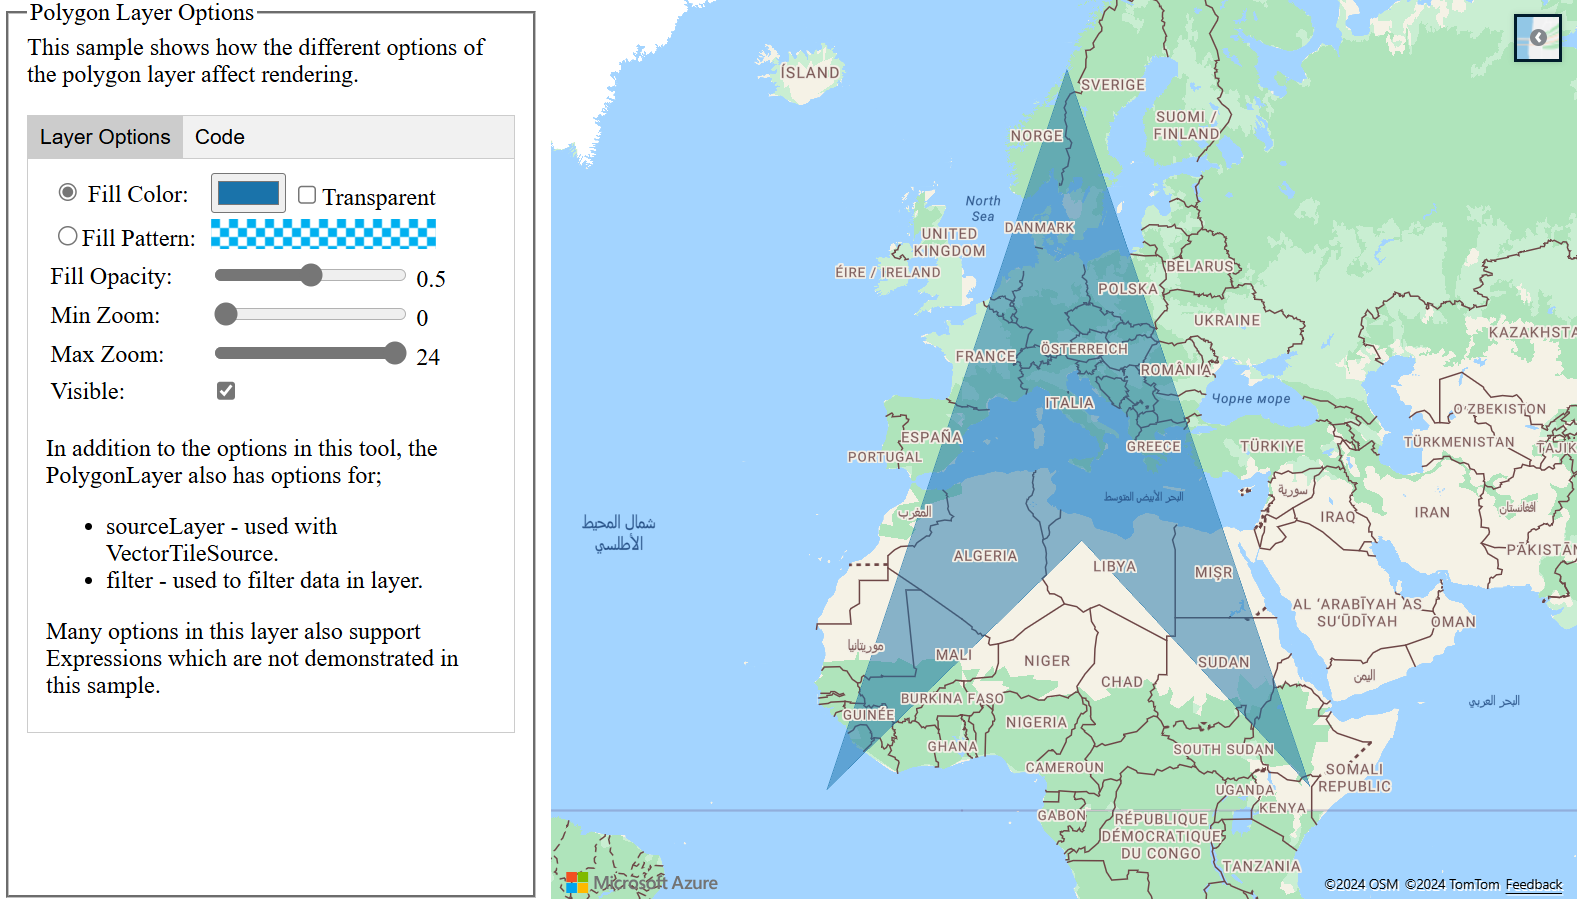
多边形层只有几个样式选项。 要试用这些示例,请参阅 Azure Maps 示例中的多边形层选项示例地图。如需此示例的源代码,请参阅多边形层选项源代码。
将圆添加到地图
Azure Maps 使用扩展版本的 GeoJSON 架构提供圆的定义。 通过创建 Point 特征,在地图上渲染了一个圆。 此 Point 具有一个 subType 属性和一个 radius 属性,前者的值为 "Circle",后者带有一个表示半径(以米为单位)的数字。
{
    "type": "Feature",
    "geometry": {
        "type": "Point",
        "coordinates": [-122.126986, 47.639754]
    },
    "properties": {
        "subType": "Circle",
        "radius": 100
    }
}
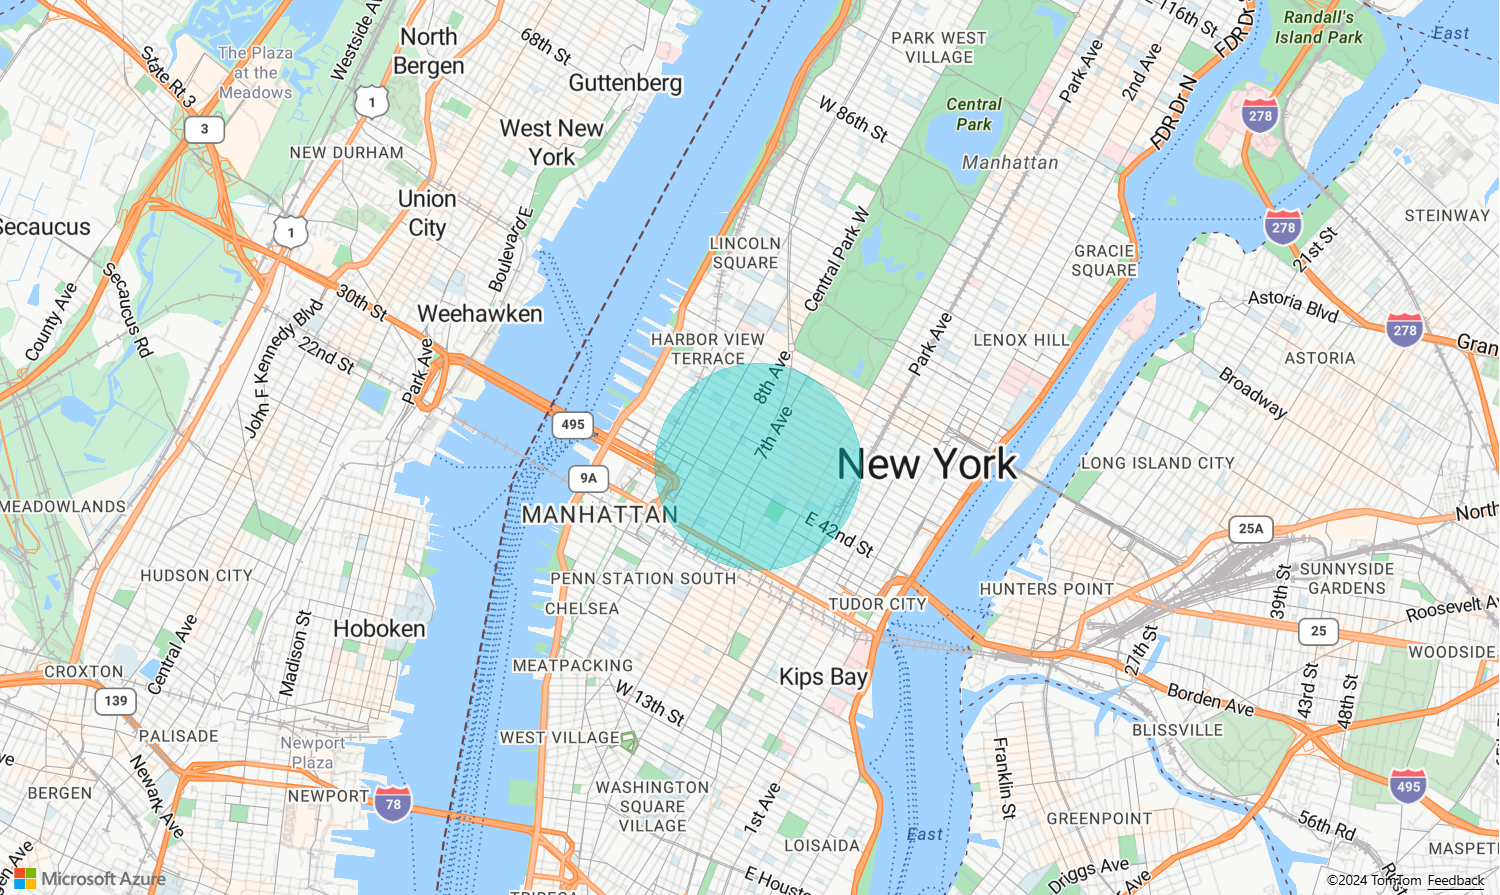
Azure Maps Web SDK 将这些 Point 特征转换为 Polygon 特征。 然后,使用多边形和线条层在地图上渲染这些特征,如下面的代码示例中所示。
function InitMap()
{
  var map = new atlas.Map('myMap', {
    center: [-73.985708, 40.75773],
    zoom: 12,
    view: "Auto",

    //Add authentication details for connecting to Azure Maps.
    authOptions: {
      // Get an Azure Maps key at https://azuremaps.com/.
      authType: 'subscriptionKey',
      subscriptionKey: '{Your-Azure-Maps-Subscription-key}'
    }
  });

  //Wait until the map resources are ready.
  map.events.add('ready', function () {

    /*Create a data source and add it to the map*/
    var dataSource = new atlas.source.DataSource();
    map.sources.add(dataSource);

    //Create a circle
    dataSource.add(new atlas.data.Feature(new atlas.data.Point([-73.985708, 40.75773]),
    {
      subType: "Circle",
      radius: 1000
    }));

    // Create a polygon layer to render the filled in area
    // of the circle polygon, and add it to the map.
    map.layers.add(new atlas.layer.PolygonLayer   (dataSource, null, {
      fillColor: 'rgba(0, 200, 200, 0.8)'
    }));
  });
}
简化几何图形更新
Shape 类包装几何图形或特征,以便可以轻松更新和维护这些特征。 要实例化形状变量,请将一个几何图形或一组属性传递给形状构造函数。
//Creating a shape by passing in a geometry and a object containing properties.
var shape1 = new atlas.Shape(new atlas.data.Point[0,0], { myProperty: 1 });

//Creating a shape using a feature.
var shape2 = new atlas.Shape(new atlas.data.Feature(new atlas.data.Point[0,0], { myProperty: 1 });
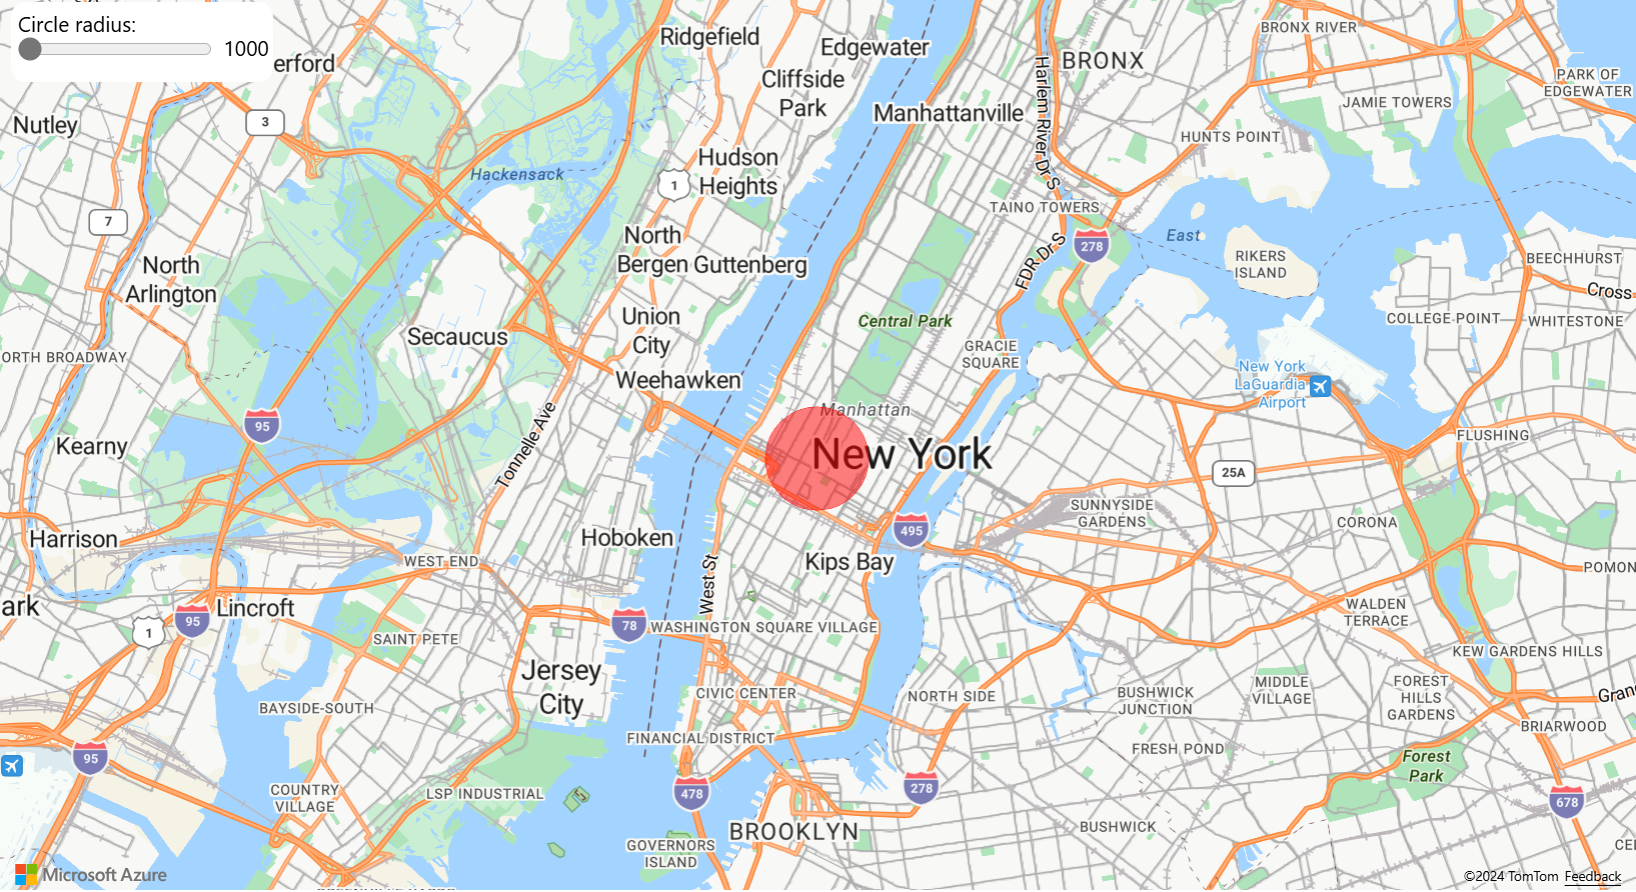
设置易于更新的几何图形示例显示了如何使用形状类包装圆形 GeoJSON 对象。 当形状中的半径值改变时,圆圈会自动渲染在地图上。 如需此示例的源代码,请参阅使几何图形易于更新源代码。
后续步骤
详细了解本文中使用的类和方法:
有关可向地图添加的更多代码示例,请参阅以下文章:
更多资源:
