你当前正在访问 Microsoft Azure Global Edition 技术文档网站。 如果需要访问由世纪互联运营的 Microsoft Azure 中国技术文档网站,请访问 https://docs.azure.cn。
Enable Azure Monitor OpenTelemetry for .NET, Node.js, Python, and Java applications
This article describes how to enable and configure OpenTelemetry-based data collection within Application Insights. The Azure Monitor OpenTelemetry Distro:
- Provides an OpenTelemetry distribution which includes support for features specific to Azure Monitor.
- Enables automatic telemetry by including OpenTelemetry instrumentation libraries for collecting traces, metrics, logs, and exceptions.
- Allows collecting custom telemetry.
- Supports Live Metrics to monitor and collect more telemetry from live, in-production web applications.
For more information about the advantages of using the Azure Monitor OpenTelemetry Distro, see Why should I use the Azure Monitor OpenTelemetry Distro.
To learn more about collecting data using OpenTelemetry, check out Data Collection Basics or the OpenTelemetry FAQ.
OpenTelemetry release status
OpenTelemetry offerings are available for .NET, Node.js, Python, and Java applications. For a feature-by-feature release status, see the FAQ.
Enable OpenTelemetry with Application Insights
Follow the steps in this section to instrument your application with OpenTelemetry. Select a tab for langauge-specific instructions.
Note
.NET covers multiple scenarios, including classic ASP.NET, console apps, Windows Forms (WinForms), and more.
Prerequisites
- Azure subscription: Create an Azure subscription for free
- Application Insights resource: Create an Application Insights resource
- ASP.NET Core Application using an officially supported version of .NET
Tip
If you're migrating from the Application Insights Classic API, see our migration documentation.
Install the client library
Install the latest Azure.Monitor.OpenTelemetry.AspNetCore NuGet package:
dotnet add package Azure.Monitor.OpenTelemetry.AspNetCore
Modify your application
Import the Azure.Monitor.OpenTelemetry.AspNetCore namespace, add OpenTelemetry, and configure it to use Azure Monitor in your program.cs class:
// Import the Azure.Monitor.OpenTelemetry.AspNetCore namespace.
using Azure.Monitor.OpenTelemetry.AspNetCore;

var builder = WebApplication.CreateBuilder(args);

// Add OpenTelemetry and configure it to use Azure Monitor.
builder.Services.AddOpenTelemetry().UseAzureMonitor();

var app = builder.Build();

app.Run();
Copy the connection string from your Application Insights resource
The connection string is unique and specifies where the Azure Monitor OpenTelemetry Distro sends the telemetry it collects.
Tip
If you don't already have an Application Insights resource, create one following this guide. We recommend you create a new resource rather than using an existing one.
To copy the connection string:
- Go to the Overview pane of your Application Insights resource.
- Find your connection string.
- Hover over the connection string and select the Copy to clipboard icon.

Paste the connection string in your environment
To paste your connection string, select from the following options:
Important
We recommend setting the connection string through code only in local development and test environments.
For production, use an environment variable or configuration file (Java only).
Set via environment variable - recommended
Replace
<Your connection string>in the following command with your connection string.APPLICATIONINSIGHTS_CONNECTION_STRING=<Your connection string>Set via configuration file - Java only
Create a configuration file named
applicationinsights.json, and place it in the same directory asapplicationinsights-agent-3.6.0.jarwith the following content:{ "connectionString": "<Your connection string>" }Replace
<Your connection string>in the preceding JSON with your unique connection string.Set via code - ASP.NET Core, Node.js, and Python only
See connection string configuration for an example of setting connection string via code.
Note
If you set the connection string in multiple places, the environment variable will be prioritized in the following order:
- Code
- Environment variable
- Configuration file
Confirm data is flowing
Run your application, then open Application Insights in the Azure portal. It might take a few minutes for data to show up.
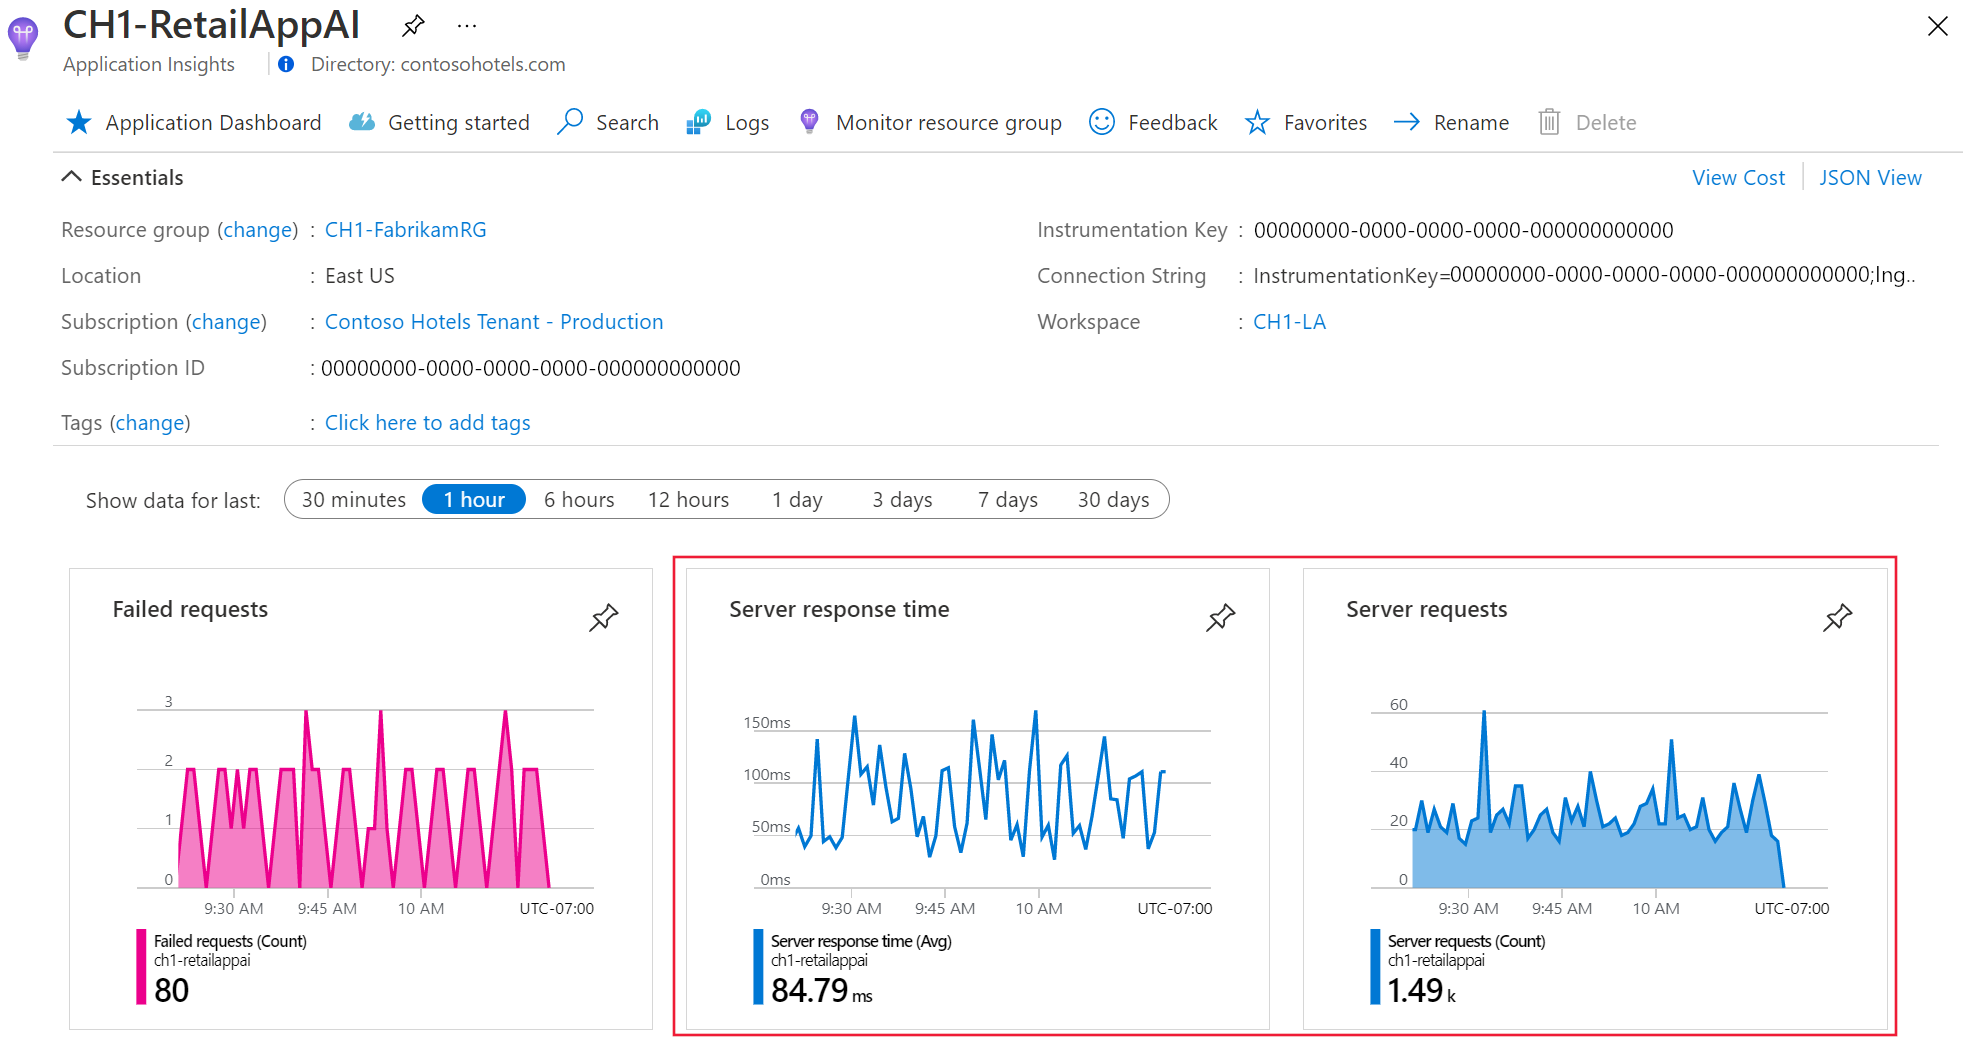
Application Insights is now enabled for your application. The following steps are optional and allow for further customization.
Important
If you have two or more services that emit telemetry to the same Application Insights resource, you're required to set Cloud Role Names to represent them properly on the Application Map.
As part of using Application Insights instrumentation, we collect and send diagnostic data to Microsoft. This data helps us run and improve Application Insights. To learn more, see Statsbeat in Azure Application Insights.
Sample applications
Azure Monitor OpenTelemetry sample applications are available for all supported languages:
- ASP.NET Core sample app
- NET sample app
- Java sample apps
- Java GraalVM native sample apps
- Node.js sample app
- Python sample apps
Next steps
- For details on adding and modifying Azure Monitor OpenTelemetry, see Add and modify Azure Monitor OpenTelemetry.
- To further configure the OpenTelemetry distro, see Azure Monitor OpenTelemetry configuration.
- To review the source code, see the Azure Monitor AspNetCore GitHub repository.
- To install the NuGet package, check for updates, or view release notes, see the Azure Monitor AspNetCore NuGet Package page.
- To become more familiar with Azure Monitor and OpenTelemetry, see the Azure Monitor Example Application.
- To learn more about OpenTelemetry and its community, see the OpenTelemetry .NET GitHub repository.
- To enable usage experiences, enable web or browser user monitoring.
- To review frequently asked questions, see OpenTelemetry frequently asked questions (FAQ) for Azure Monitor Application Insights.
- To review troubleshooting steps, support options, or to provide OpenTelemetry feedback, see OpenTelemetry troubleshooting, support, and feedback for Azure Monitor Application Insights.