Debugging and Tuning Web Sites and Apps with F12 Developer Tools in IE11
Internet Explorer 11 on Windows 8.1 and Windows 7 comes with a completely redesigned and enhanced suite of in-browser developer tools that help developers build, diagnose, and optimize modern Web sites and apps across multiple devices. The new tools, which we call F12 for short, enable Web developers to work quickly and efficiently.
The Visual Studio and IE teams have worked together to build F12 with a core principle of helping you get from problem to solution quickly with actionable data. The new F12 enables you to deliver fast and fluid Web experiences with tools for diagnosing and fixing performance issues and tools that give you deeper insight into how IE is laying out and rendering your app. F12 supports the fast, iterative workflow used by modern Web developers.
A Comprehensive Toolset
The new F12 helps developers get from problem to solution quickly. Some of the biggest new capabilities include:
- UI responsiveness and memory profiling tools to help you build fast and fluid Web apps
- Live DOM explorer and CSS inspection tools that update with your page so you can iteratively explore how dynamic content is affecting layout or styles
- JavaScript debugging that starts quickly without a page refresh so you can get to work more quickly
As you use F12, you’ll notice many other enhancements that will help deliver a fast, iterative workflow:
- Quick entry into the tools through an “inspect element” right-click menu item
- An experience that you can drive from the keyboard
- Rich copying of elements and items from the tools, so you can paste into the editor of your choice without reformatting
Most important, the tools now show the most accurate and comprehensive information, from @media rules and !important in the DOM Explorer, to per-element layout costs on the UI responsiveness profiler. The tools also provide directly actionable data; for example, the memory profiler identifies all DOM nodes that are alive but not referenced from the markup or render tree.
The new F12 shares many of these experiences with Visual Studio so that developers get a consistent experience across the continuum of Microsoft’s Web development tools and platforms.
Let’s take a quick look at some of these tools in action.
Profiling an App with the UI Responsiveness Tool
The UI responsiveness tool helps you understand where CPU time is spent, so your app can achieve its greatest performance potential. The tool gives you the necessary insight into the inner workings of IE by providing you with a timeline visualization of HTML, CSS and JavaScript execution, along with important side effects such as layout and garbage collection. At a glance you can see exactly how responsive your app is as well as how fluidly it is rendering. This enables you to identify the specific source of any bottlenecks, which enables you to make more informed optimizations.
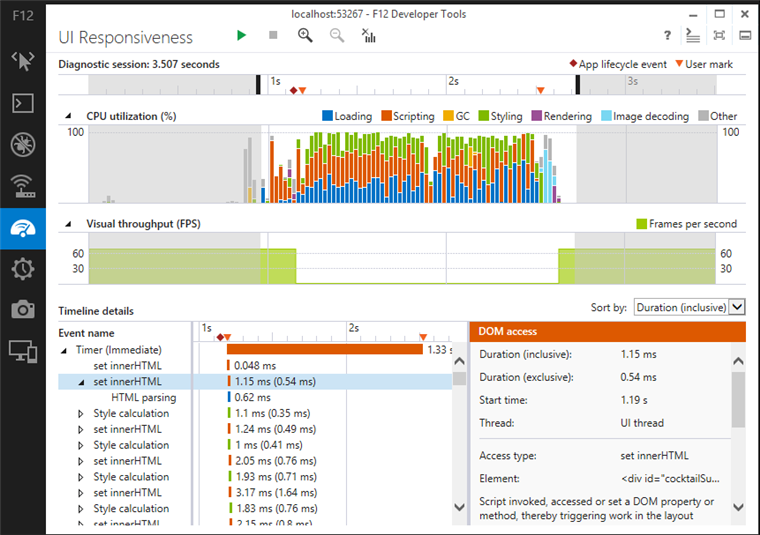
Profiling a Web site
Understanding an App’s Memory Consumption with the Memory Profiler
The memory tool helps you avoid memory leaks or excessive memory use. Building Web apps that consumers keep running all day or complex interactive apps often means you have to pay more attention to memory usage in your app.
Although JavaScript is a garbage collected environment, apps commonly consume more memory simply because references to objects weren’t released and can’t be freed. The memory tool helps find those problems by giving you information on every object in the page, whether it’s in JavaScript or in the DOM. With this information, for example, you can see how much memory an <img> is holding on to and which objects are keeping it alive. Best of all, you can diff between two snapshots and see what has changed, so you can figure out why your app is using more memory and fix it.
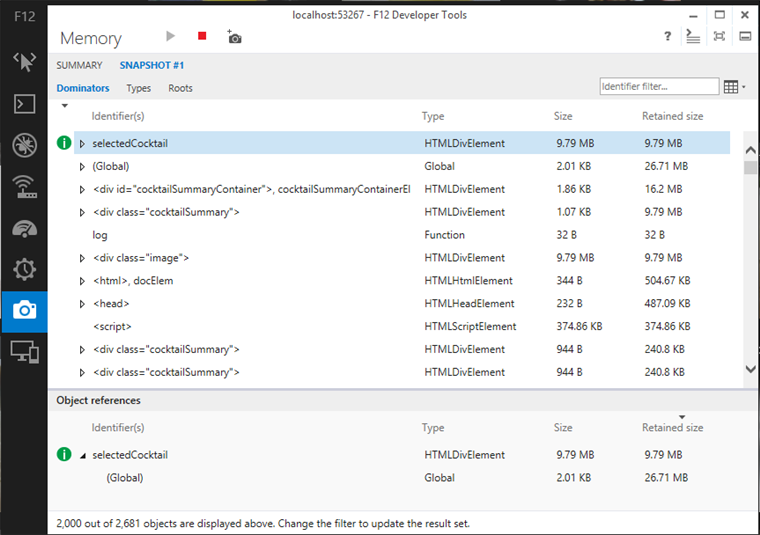
A heap snapshot showing disconnected DOM elements
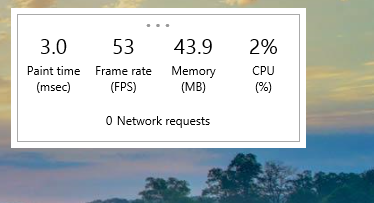
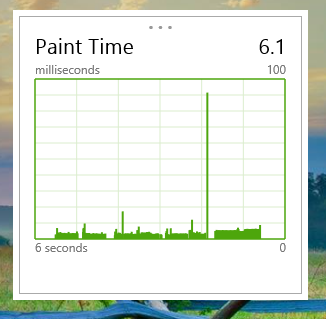
Getting Immediate Insight to an App’s Performance with the Performance Dashboard
To help you quickly identify performance problems on your running page, IE11 has an on-page widget called the performance dashboard that can be accessed through Ctrl+Shift+U or through the Tools (Alt+T) menu option. It draws in IE and provides live statistics for key performance metrics such as paint time, memory, frames-per-second (FPS) and CPU utilization. The performance dashboard does not require F12, and can be used in the immersive browser too.
With the performance dashboard, you can quickly identify page interactions that cause frame rate drops or high CPU utilization. You can then switch into the F12 tools to reproduce the issue and find the solution.
Inspecting Elements and Modifying Layout and Styles with the DOM Explorer
The DOM Explorer simplifies the interactive process of tuning your @media queries and your CSS rules and their properties, so that your app’s UI is perfect and responsive across multiple devices. You can quickly start in the Web page by right-clicking and inspecting an element, which launches F12 with that element selected in the DOM Explorer with the live DOM and applied CSS rules displayed. The DOM and CSS you see is live, so you can understand how IE is interpreting your markup, your styles, and CSS rules specificity. As you interact with the page or edit it through the DOM Explorer, your changes are reflected immediately.
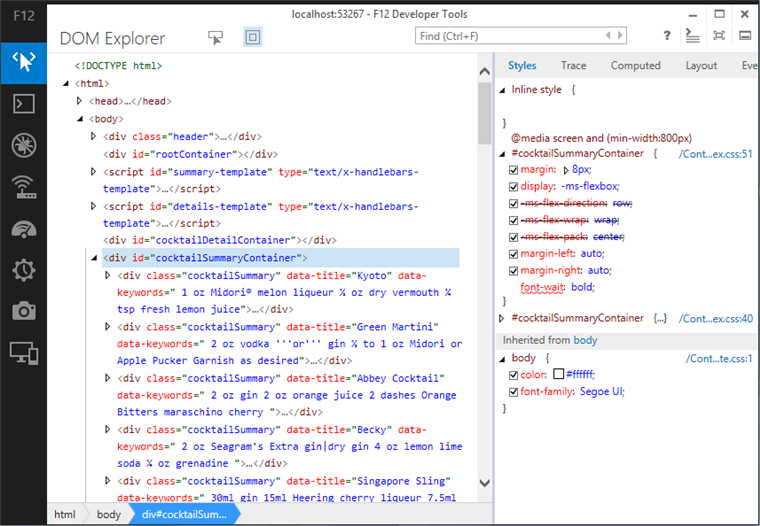
Inspecting Mark-up and Styles
As you make CSS changes, the DOM Explorer makes it easy to get the right property or property value with IntelliSense. You can easily see which properties are in error or unrecognized and then copy the rule to apply back to your source.
Debugging JavaScript with the Debugger and Console
The new JavaScript debugger gives you the tools to locate and fix error-prone code quickly. The JavaScript debugger can open and view multiple files even if your library script was minified, set breakpoints and trace-points, inspect JavaScript objects, values, scope chains;, and see stack traces. When you start F12, the JavaScript debugger starts immediately, so you can get right to work
You will likely want to interact with your Web site as you are debugging. To do that, the console is a key tool. You can access the console at all times, making use of its interactive environment with IntelliSense and object visualizers galore. The console also provides a range of specific APIs that enable you to log output, understand the amount of time spent in specific code, or provide object visualizers when you need to inspect your JavaScript objects deeply.
Summary
This post just scratches the surface of what’s new in F12. You can find a full list of new functionality available to developers in the IE11 “What’s new in F12 Tools” and in the IE11 “Preview Developer Guide.” You can also learn more with the IE Test Drive, “F12 Adventure.”
Please install the Windows 8.1 Preview from the Windows Store and try IE11, or try the IE11 Developer Preview for Windows 7.
We look forward to your feedback and engaging with the developer community. Please share your suggestions either through the IE11 Send Feedback tool or on Connect.
— PJ Hough
Vice President, Visual Studio
Comments
Anonymous
July 29, 2013
The comment has been removedAnonymous
July 29, 2013
Before IE11 is released can you PLEASE ensure all the glaring bugs are fixed from IE10?? I've catalogued the ones I've experienced here: answers.microsoft.com/.../c8d79e2b-8e6e-4734-bed2-7dbc4369175c Thanks!Anonymous
July 29, 2013
The new F12 is a serious improvement. The only thing I hate about it is that UAC needs permission to open it, I hope that will be gone in the final? However, now only the option screen with a redesign and I'm happy.Anonymous
July 29, 2013
@ Mitch 74: When a shorthand property has been specified, F12 in IE11 displays just the shorthand property/value with an option to expand to its constituent properties. When a longhand property has been specified, F12 will display the longhand property/value. If you're still experiencing problems with shorthands in IE11, please provide us with repro steps so we can investigate it. Thanks!Anonymous
July 29, 2013
I miss the old Browser & Document Mode menus from the old F12 developer tools. There doesn't appear to be a direct replacement in the new dev tools. Please consider bringing them back. The are helpful when debugging old IE sites.Anonymous
July 29, 2013
@JeffLoBello +1Anonymous
July 29, 2013
Use the "Break on all exceptions" setting in the debug console to solve hard to diagnose handled exceptions in third party modules like jQuery. see connect.microsoft.com/.../jquerys-closest-method-fails-sporadicallyAnonymous
July 29, 2013
First, your new debugging tools are too slow. Please bring back a fast launch. The UI is not as intuitive as the old one. Shallow menus are more discoverable. One example is that I did not find a way to edit (add rules to) external CSS files. +1 for bringing back browser and document modes. Sure it's not perfect. (Nothing short of a dedicated VM is, because of fonts, network stack and such, and you got enough complaints to understand how much of a pain VM are). Even with it's limitations, browser and documents modes was a useful feature for quick tests. Finally, I dislike how the UI looks. Not everyone like this flat "Modern" appearance. Please make it mode desktop-like.Anonymous
July 29, 2013
There needs to be a right-click "Inspect Element" context menu like Chrome or I'm not even looking at IE11 for development purposes. It takes two steps to view an element in the DOM in Chrome vs. 4 in IE. When you are repeating this operation a few hundred times a week, it adds up and it gets in the way. Chrome: Right-Click > Inspect Element IE: Remove hand from mouse > F12 > Click the pointer icon > Click the elementAnonymous
July 29, 2013
As mentioned by others, the lack of browser/document mode toggles is very unfortunate. Yes, I understand that VMs are very useful, They're great for a final run through. But the old version was far more helpful. I'm aware that it is still sort of there if the site is not set to "Edge", but it would be remarkably helpful if we could still access IE7-10 even if it's set to Edge.Anonymous
July 29, 2013
@EdC I'm on IE11 and they have a right-click -> Inspect Element option. It's right under "View Source". Didn't need to open the F12 tools.Anonymous
July 30, 2013
@Brian Gus Perez also confirmed this on twitter (@gusper). So now I'm excited to see the improvements!Anonymous
July 30, 2013
I have a question regarding document modes. It states the HTML5 doctype -- <!DOCTYPE html> -- forces edge mode. msdn.microsoft.com/.../bg182625%28v=vs.85%29.aspx Is this always the case? Does it overrule the Compatibility View Settings window (the 'display all websites in Compatibility View' and 'display intranet sites in Compatibility View' settings)? (I'm hoping the answer is 'yes'!) Thank you for your time.Anonymous
July 30, 2013
It is indeed so slow @ Win8.1... Can barely open it. Barely move mouse around menus... Not to mention about Browser and document modesAnonymous
July 30, 2013
@IE team, Thank you for the initiative of overhauling F12 developer tooling. But we are expecting few improvement in the existing features by final release. Please do not exercise the same behavior with the developers of your ecosystem who are giving you feedback.... all the below feedback items, pertaining to F12DT, are closed with some convoluted reason: connect.microsoft.com/.../791981 connect.microsoft.com/.../791982 connect.microsoft.com/.../792543 I wonder why didn't you guys did it right in first place? Firebug for Firefox and Chrome dev tools are certainly not new to anyone in web development and they are great source of inspiration... Do you expect us to wait for IE12 or 13 to resolve these issues (which would probably not supported on Windows 7)? @Program manager - F12DT team, please do not ignore our feedback and please complete the features which we all are profoundly wanting. Its not just about YOU and YOUR definition of good enough, its what we -- the developer -- need. Filter the related bug reports on connect and have a little survey if you really care! This is very painful to see you shooting your own foot. Please help us help you to make our ecosystem better! Sincerely yours.Anonymous
July 30, 2013
Please bring back colour picker tool. Also provide colour picker and colour selector (like in VS2013) in CSS editor.Anonymous
July 30, 2013
The comment has been removedAnonymous
July 30, 2013
Good to finally see improvements attempted but every time I use the dev tools I crash the entire IE process. You need to put some serious effort into fixing bugs and making these stable. Also the new tools are not very logical. Not that your last tools were logical but Chrome and Firefox does better job of logically representing my code and IE is just weird. I tried hard to like the new tools but tough.Anonymous
July 30, 2013
@Sven: <!DOCTYPE html> alone won't guarantee edge mode. For example, if you have a site on the Intranet and you have the option to "display Intranet sites in CV" option checked you'll still end up in legacy modes. You can add the X-UA-Compatible on the page or send a server header to force edge mode even in those cases. In IE11 we removed the "Display all websites in Compatibility View" option entirely.Anonymous
July 30, 2013
Developing for IE is like adjusting rabbit ear antennas for a TV.Anonymous
July 31, 2013
The comment has been removedAnonymous
July 31, 2013
@Stephan:
- We've definitely heard the feedback about KB2846071 and are investigating.
- The magenta issue in the dev tools is a timing issue that appears to happen on some machines and not on others. We're already testing a fix in our internal builds. Thanks for letting us know!
- If you have specific steps that consistently lead to a crash in the dev tools, please file a bug on Connect so that we can investigate. Connect.Microsoft.com/IE.
- Can you share a little more detail about the TextArea bug? A link to a Connect bug would help me investigate further.
- I hear you. Several of us are pushing very hard to get this fixed. I've lost several comments myself and it's very annoying.
Anonymous
July 31, 2013
The comment has been removedAnonymous
July 31, 2013
The comment has been removedAnonymous
July 31, 2013
And a personal note to @pmbAustin No one cares how easy it is or isn't to register a Microsoft account to post a comment. THAT'S NOT THE POINT! If the form is going to be open (which it most certainly should!) then that has to work too. Not some of the time. Not most of the time. All of the time! This is basic 101 HTML form technology we are talking about. Only Microsoft (and the Community Server Blogware) software has this issue. Every other site doesn't have this issue because it is a SOLVED PROBLEM! Sadly someone at Microsoft (in the legacy ASP dev team) tried to circumvent the default behavior (and someone at Community Server decided to implement it without proper testing) - fail. More importantly if you know that this site is broken - help Microsoft by being the squeaky wheel to get this bug fixed - not trying to sweep it under the covers as a non-issue. 1,000's of comments have been lost because users had no idea that Microsoft's flagship blog comment form was designed over a decade ago by a programmer that didn't understand the technology on a platform that didn't understand how the web was being used.Anonymous
July 31, 2013
Huh, I just noticed that Ctrl+Q was removed in IE11 - can we have that back? Same for the Document Mode switcher in the developer toolbar, to check IE7-8-9 behaviour. That thing was really useful.Anonymous
July 31, 2013
On another note, I've noticed that add-ons now load in every frame process, which significantly raises compatibility with older add-ons. So it is no longer necessary to force TabProcGrowth = 0 to get some essential add-ons to work. This is a VERY welcome change and I really hope that it will stay that way into the final release!Anonymous
July 31, 2013
For the messed up popup windows in IE here's the registry key you need to reset because Microsoft's Developers and Q.A. are not paying attention. Registry Key: ComputerHKEY_CURRENT_USERSoftwareMicrosoftInternet ExplorerMainWindow Title Change the value from: "Internet Explorer, enhanced for Bing and MSN" to: "Internet Explorer" or: "Internet Explorer 11 Alpha Preview - watch me crash!"Anonymous
July 31, 2013
The developer tools seem to cause a system wide problem in the context menu. Whenever they crash (which happens often), they cause some problem in whatever function that is used to open the right click context menus in Windows 7. Once this bug gets active, a right click context menu will not fade in properly, it displays only at a low opacity. When any selection is made on any context menu afterwards with the mouse, the selected context menu becomes permanently etched into the foreground. The only way for it to get removed is to do a change that causes a display refresh - such as any application going fullscreen and then exiting, disabling/enabling DWM, and so on. Then the bug can trigger again once you use a context menu again. However pressing the context menu keyboard key will not trigger this oddly enough. This effect stays there until reboot. I'm inclined to think that this is a videocard driver bug though (using a Radeon 6950 with Catalyst 13.4).Anonymous
July 31, 2013
@Even:
- As I mentioned in my earlier reply to TheDees, we're working to improve Connect (the site) and our process for managing Connect bugs. As I mentioned above, one change we're already working through is to make Connect IE version-agnostic, so if you file a bug we will leave it active if we want to fix it but just can't fit it into the current release. We're still working through the details, so please let me know of cases where you see bugs gets closed when they should not.
- Thanks for sharing that link, that's what I thought you were seeing. Have you tried that repro on IE11? That was one of the cases that we tried to fix in this release, and in my repro case (christianstockwell.com/.../textarea.htm) I do see that IE11 now behaves correctly even though IE10 did not. It would be great to know if you're still seeing something that we haven't addressed in IE11.
- Thanks for the detailed summary. We'll continue pushing for a fix and hopefully we'll have something positive to report back :)
Anonymous
July 31, 2013
@Christian Stockwell (MSFT) On Connect, what is the difference between a bug that is "closed by design" as opposed to one that has been closed as "postponed"? Do you randomly assign these labels? Because, currently, they make no sense! When a new version of IE comes out, we would have to re-file existing bugs anyway. So, marking something as "postponed", makes no sense. Similarly, many bugs that are now marked as "closed by design" are, I hope, issues that you would consider for a future release. It does not make sense to close them for ever. So, what is the purpose of the "closed by design" label? I think that when you see a bug you don't like you just click a close choice at random, while murmuring to yourselves: "Who cares? They will re-file it next time". Well, we are not going to! We are not your paid secretaries who have the time and energy to re-visit, re-test, re-file, re-try and do all the re-s. We are not Microsoft servants. Please do the job yourselves! Go back and look at the Connect bugs for IE 8, IE 9, IE 10 and IE 11, figure out which ones should still be active and consolidate in a single list. Mozilla, Google and others have been running an open bug database for years. Why can't you? Please explain. I want to know what is so hard about it. Even the MSDN feedback system is broken. When you provide feedback on a page it only has three choices: "Information is not accurate", "needs more information" and "More code examples". Well, firstly not all pages need code examples, so the third option is out of place. Plus, so many other choices like "information is confusing", "spelling or grammatical error", etc. are missing. Look at Google help sites and their feedback choices for example. Complete and to the point. MSDN is broken after 15 years. And the documentation sounds as if it is written by a robot. It is not conversational in style. So, where is an open and good bug database? Where can I give feedback as a user without having to go through hoops? Why is the developer documentation still so bad like in Chrome? What's wrong with you guys? What's so difficult? Company bureaucracy? Open source projects can set up a bug database within a day. They can set up a functioning blog commenting system again in one day.Anonymous
July 31, 2013
Oops! I meant to say: So, where is an open and good bug database? Where can I give feedback as a user without having to go through hoops like in Chrome?Anonymous
July 31, 2013
@Christian Stockwell (MSFT) I am blind and use a screen reader. It's called Jaws (version 14). I can't use the new developer tools. I can't read the code I am debugging. Please please help me. Chrome's developer tools are inaccessible. Firebug is not fully usable too with assistive aids. IE was using standard Win32 controls and so I could use its developer tools to do my job. I still need to continue doing my job. Do not release IE 11 without fixing the accessibility of your developer tools. Please!Anonymous
July 31, 2013
Too Bad , I can not change the compatibility mode for the websites , Please do not take away 1) Color Picker 2) option to change the CompatibilityAnonymous
August 01, 2013
The comment has been removedAnonymous
August 01, 2013
@Jason: Thanks for the follow up test case. I haven't been able to find the specific bug that we fixed between the public preview and our current internal builds, but in my testing I can reproduce the issue you're describing on the Windows 8.1 Preview and cannot on our more recent internal builds. It looks like it's fixed :) I appreciate your frustration with Connect. I'm certainly sorry that we've fallen short of your expectation of Microsoft. We're interested in improving both Connect and our bug management process, but to do that we need your help. When possible, please continue to file bugs and keep us accountable when you think that we've resolved a bug incorrectly. Feedback from Connect users (like The Deeds' feedback above) has already helped us identify several places where we can tweak our process to make Connect a more effective tool.Anonymous
August 01, 2013
"Debugging and Tuning Web Sites" Really? You seriously believe debugging on IE11 is sensible? Two word: DOCUMENT MODES Really Microsoft, come on. D O C U M E N T M O D E S ! ! I expect them to be back in the next developer update, or I cannot take IE11 serious as a debugging tool. That, or make it possible to run multiple versions side-by-side. Do not force people to use a VM.Anonymous
August 01, 2013
IE11 F12 menu bar?Anonymous
August 01, 2013
I may not be blind, but I'm still concerned about what BlindProgrammer has been reporting for a little while (see previous article comments for more details). So far, I haven't seen anyone from Microsoft address this. What's up?Anonymous
August 01, 2013
STOP making browsers! You owe developers Billions of frustrated hours!Anonymous
August 02, 2013
@Stifu: I'm not an accessibility expert and don't have a site license to Jaws so I haven't commented. We've filed a bug for the F12 team to investigate and they're digging in.Anonymous
August 02, 2013
@Christian Stockwell [MSFT]: Cool, thanks.Anonymous
August 02, 2013
The comment has been removedAnonymous
August 02, 2013
The best what Microsoft can do is get old browsers upgraded to at least IE9, IE11 is far away, a dream. IE8 and below are a barrier for the development of next gen apps. Still we have IE8, which contributes 5% of the internet traffic. So it makes no sense whatever awesome browsers you develop until you replace the old ones.Anonymous
August 02, 2013
I agree with @Sanket IE8 is the new wall as IE6 was Consider that now browsers are used as universal client for any kind of service also in the INTRANET We have hundred PC with XP because it is more than enough and due the business rules no internet browsing is admitted. No third-party browser is allowed, domain policies are VERY strict. So we still developing and maintainig the frontend application for IE8 untill the last single old PC will die and be replaced.Anonymous
August 02, 2013
@Christian Stockwell [MSFT]: Also I hope it will track if bugs are fixed in cumulative updates for older versions of IE.Anonymous
August 03, 2013
The comment has been removedAnonymous
August 05, 2013
@BlindProgrammer: Thank you for the detailed feedback--I'm going to make sure that it gets to the tools team.Anonymous
August 06, 2013
@Christian As other fellows have stated, you (Microsoft) are the ones that have managed to drive us away from your Connect site, so you have to review carefully all the problems that we have stated if you want to ever trust you again. Testing, debugging to find a simplified testcase, writing everything down takes time. You can't just say that you will try to review your procedures for IE12, you should review them right now. Put someone tasked to look after every bug that was reported for IE9 and IE10 and it was closed as "by design". Every one of them. Now check if that bug exists in IE11, if the problem still exits then it's time for someone with more knowledge to look at the report and decide if it's something that you never plan to change, if it was a bad report (someone asking to change something that it's a security problem), or if it's something that would align the behavior of IE with other browsers and the web development. Then for every one of those valid reports, re-open them or create a new list stating known issues with IE that you don't plan to change in IE11 (due to lack of time, too complex at this point, etc...) just keep that list alive, show us that all the issues that were reported have not been deleted and forgotten. I tried to give IE11 a chance last week, so I downloaded it because I was interested in the new features related to inserting images from the clipboard. Obviously I quickly found that despite your claims about compatibility my current code didn't work so I filed a bug report stating the problem: connect.microsoft.com/.../clipboarddata-should-be-a-member-of-the-event-and-not-of-window Unfortunately the almighty "Microsoft" closed it after 30 minutes, and when I woke up next morning I added the requested url so you could test and verify that IE11 doesn't match the behavior of Firefox and Chrome, so any existing code that tries to pick files from the clipboard won't work in IE11 and the users will wonder why you claim that you have added this feature when in fact it doesn't work as expected. There are further comments that I would love to do so you could enhance it and make IE11 the best browser with regards to handling clipboard operations, but you can bet that I won't be wasting my time writing them if you're gonna throw them to the bin that way. It's in your hands. PS: (I was smart and I remembered to copy everything that I wrote here before pressing "Post" or I would be really angry)Anonymous
August 06, 2013
@Alfonso: Thanks for the bug report, I'm following up on that "By Design". With the html file you provided I can see that we have the clipboarddata on the window object rather than the event object. I'll get it sorted out. Regarding your first few points: Several of us are working to improve our Connect site, and we're starting by trying to address some of the biggest issues with Connect first--eliminating the sign-in requirement, keeping bugs alive even if we can't fix them in the current release, and other top pain points. Whenever possible we're also working to make sure that great bugs get opened/reopened, but we're also trying to balance that time against the time we spend making IE11 great. I know that it's asking a lot, but I do appreciate your help and encourage you to keeping filing bugs on Connect. When we fall short of your expectation, let us know! We aspire to perfection, but until we get there all I can promise is that we care and want to improve.Anonymous
August 06, 2013
@Christian Thank you. For me, signing in for Connect is not a problem, I don't know who has thought that the requirement for signing in is a problem because I think that any other bug tracker requires the user to have an account or it becomes impossible to request back any extra info to the reporter, get notified about changes, etc... Any real developer that wants to see a bug fixed will gladly sign in as long as he feels that you're treating the reports correctly. And also it should help you notice if a person is usually reporting garbage or he has been working for years providing testcases and the such. As I said, as a simple solution you could just publish a page with a listing of bug reports that you acknowledge that should be kept alive for future versions of IE but that won't be targeted for the current version and that would be great. No misunderstandings, no big changes to the bug tracker, publishing such a list and adding there any previous and new report that you want to close as not something that will be done for IE11 is a "simple task" that doesn't require any investment, nor even a commitment to fix those issues for IE12, it would be a first simple step to make people return back . RegardsAnonymous
August 08, 2013
@Alfonso, @Christian I think the issue with signing into Connect is that it used to be required to view a bug. (I'm presuming that this bug has been fixed!) however it is CRITICAL that viewing bugs not require a login so that when bugs are posted on Twitter & Facebook and shared on this blog (and other blogs) readers can quickly check them out AND run the test cases to verify if the bug exists for themselves (or maybe even confirm that it isn't widespread... maybe only IE11 preview is affected.. maybe IE10 and up? (e.g the Textarea bugs). If connect isn't open to this level of read-only view access then you know what your job is to fix before the weekend ASAP!Anonymous
August 09, 2013
@Jake I've checked right now and I can see the bug reports in connect.microsoft.com/.../Feedback including attached files, so if people are still upset about that problem, the very least that they should do is test and check how Microsoft has already fixed itAnonymous
April 21, 2015
F12 Developer tool is really handy for UI development. But, any JavaScript based validation can be easily bypass using browsers like IE11 using its debugging features. Moreover if authorization is implemented for any app through JavaScript, that can be also hacked by putting different role, value through JavaScript or CSS. Do we have any path or solution which will disable the F12 developer tool and that will not allow user to enable again.