Debugging a Project Server Workflow in Visual Studio 2010
The How to: Install and Test a Project Server Workflow article in the Project 2010 SDK needs information about how to debug a workflow. Because Visual Studio 2010 can install a workflow solution on the local Project Server computer during development and testing, you can use Visual Studio to attach to a process that the workflow uses.
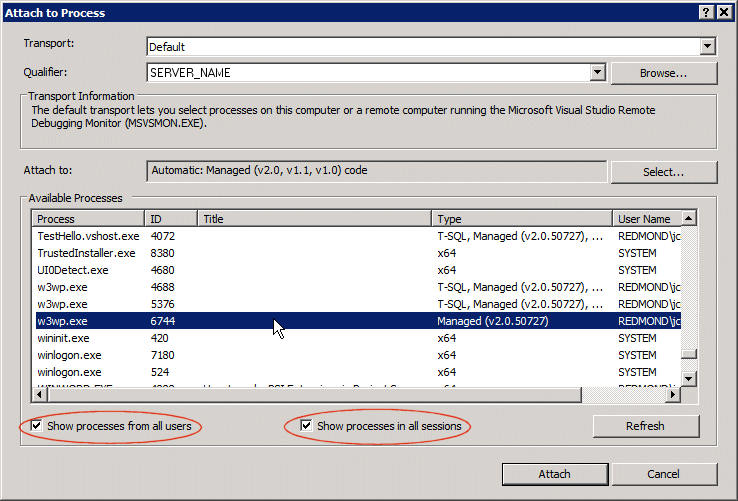
After you deploy the workflow project in Visual Studio, on the Debug menu, click Attach to Process. In the Attach to Process dialog box, check Show processes from all users and Show processes in all sessions.

Following are considerations to choose the correct process:
If the workflow creates a project or does another operation that uses one of the Queue methods in the PSI (for example QueueCreateProject), the process uses the Project Server Queue Service. In the Attach to Process dialog box, click the Microsoft.Office.Project.Server.Queuing.exe processes.
Note: There is a queue process for the application server and for each Project Web App instance. You can attach to all the queue processes, or check the ULS log for the ID of the queue process, and then convert that into a decimal value. For example, if the Microsoft.Office.Project.Server ID is 0x0FFC in the ULS log, the Microsoft.Office.Project.Server.Queuing.exe process ID is 4092.
When you submit or restart the workflow, the workflow runs in a w3wp process. Click one or more of the w3wp.exe processes . You can sometimes determine which w3wp process is involved, and find the process ID as in the previous note. Otherwise, attach to all of the w3wp processes.
If the workflow uses an approval process that includes many approvers, it might run under the SharePoint timer process. Click the OWSTIMER.EXE process . This is not common.
When you attach to the correct process, a breakpoint remains as a solid red dot in the left of the code pane. If you do not attach to the correct process, the breakpoint turns into a hollow red circle with yellow caution indicator, and the tooltip for the breakpoint states, “The breakpoint will not currently be hit. No symbols have been loaded for this document.”
When you click Attach, Visual Studio is ready to catch a breakpoint that you set in the workflow code.
Comments
Anonymous
July 27, 2010
Hi Jim, I'm trying with no success to debug the example project custom workflow that comes with the SDK. For some reason the breakpoints remain hollow and will not be hit. I think I've done all of the mentioned steps in the reffered article in in your blog post. Any idea as to why the breakpoints won't hit? Thanks, Roy GilboaAnonymous
July 29, 2010
Hi Roy, If none of the w3wp processes work for debugging, before you attach to a w3wp process, reset IIS, attach to the new w3wp process, and then submit or restart the workflow. --JimAnonymous
February 01, 2011
Hi Jim, I have the same problem, so I restarted IIS, then attached it to all the w3wp processes. But still it does not hit. Can you please suggest me what further thing I might need to do to hit the breakpoint? Thanks ZiadAnonymous
July 17, 2014
I also had the same problem, reolved now. Please attach Microsoft.Workflow.ServiceHost.exe process as well.