SQL Server 2008 - Performance Studio
I've been looking at this new feature of SQL Server 2008 in order to demo it to customers, and I have to say it's pretty cool ! Along with Resource Governor and compression, it's one of my favourite new features and a good reason to consider an upgrade. Performance Studio builds on the concept of the Database Reports in SQL Server 2005 and the Performance Dashboard introduced in SQL Server 2005 SP2. Like it's predecessors, it's built on top of standard DMV's but with one crucial advantage... data is historical and is persisted across service restarts. Previously, you had to roll your own code in order to persist DMV data, now SQL Server 2008 gives you it straight out the box.
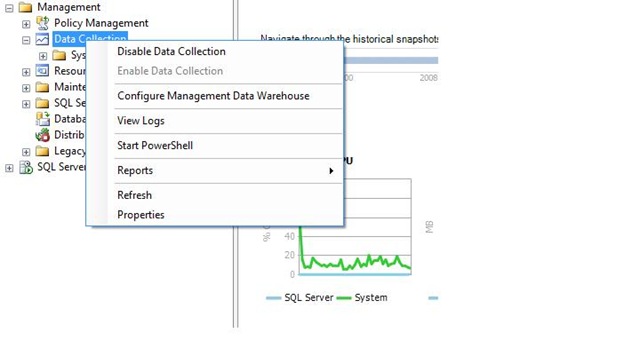
Setting it up is easy... expand the 'Management' folder and then right-click 'Data Collection' then 'Configure Management Data Warehouse'. This opens a wizard which guides you through the configuration of the Management Data Warehouse (MDW). Select the 'Create or Upgrade a Management Data Warehouse' option and enter your server details. You can either configure a new database or use an existing one in order to collect the performance data.
Once the MDW has been configured, run through the wizard again and select the 'Set up Data Collection' option. At this point you need to also ensure that SQL Server Agent is running or else the performance counters will not be uploaded to the database. Also, SQL Server Integration Services is required to manage collections. There are 3 new database roles in the MDW database: MDW Admin, MDW Writer, MDW Reader. It's a good idea to restrict access to this database, especially if you are collecting sensitive data. Performance Studio will only collect data against SQL Server 2008 databases, so unfortunately you can't use it to monitor older versions of SQL Server. MSDB is used to store the log entries, Agent jobs and SSIS packages.
When creating the MDW, plan for data growth of up to 250 - 500 MB a day, depending on your query plans and consider running an archive job to aggregate summary data before SQL Server runs it's purge job after 14 days. Regarding performance overhead, Microsoft detected approximately 3 - 4% increase in CPU performance on it's TPC-C tests, which is fairly low overhead.
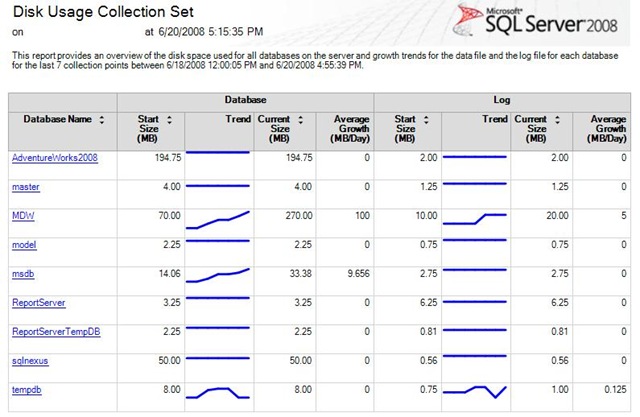
Performance Studio comes with 3 built-in Collection Sets: Disk Usage Collection Set, Query Activity Collection Set and Server Activity Collection Set. The Disk Usage Collection Set collects data every 6 hours and retains it for a default of 730 days. It gathers data and log disk usage and plots them over time. This gives a nice visual view of data file growth over time.
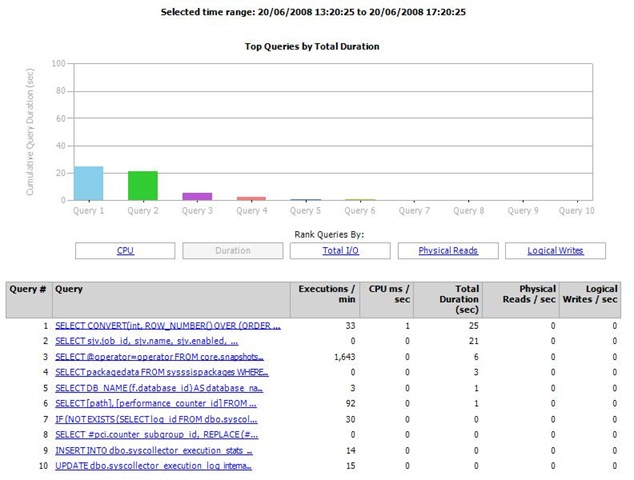
The Query Activity Collection Set uploads query activity every 15 minutes and retains it for 14 days. It caches active sessions and requests from DMV's every 10 seconds. It uses dm_exec_query_stats and uploads the 3 most "interesting" queries and any queries where the query plan has changed. What constitutes an interesting query, I have no idea :-) These can then be viewed graphically based on CPU, Duration, Total I/O, Physical Reads or Logical Writes. You can drill-down into the reports to show the query text, query plan, showplan and any missing indexes identified that could improve the query execution.
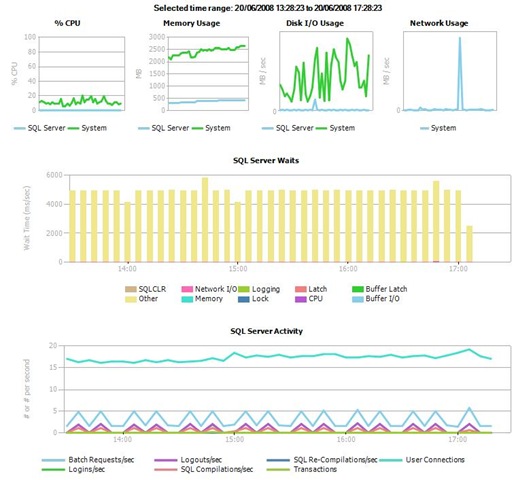
The Server Activity Collection Set may turn out to be the most useful performance tuning weapon. Data is uploaded every 15 minutes to the MDW and is collected every 10/60 seconds depending on the particular counter. This data is retained for 14 days before being purged. It collects data on Server CPU usage, Memory, Waitstats, Disk I/O and Network Usage, amongst others. Again, you can click through these reports for detailed information.
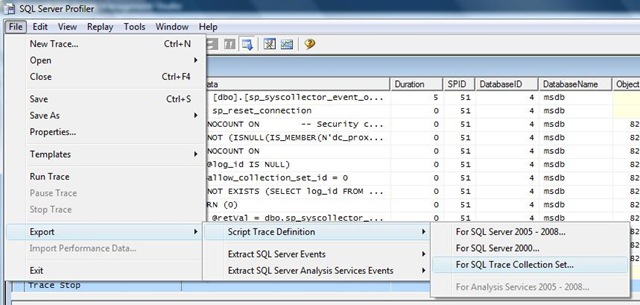
In addition to the built-in functionality, you can also create your own collection sets, however be careful doing this or you may end up collecting huge amounts of data, particularly if you run a SQL Trace collection. If you do want to create a custom Profiler collection, set up a trace in Profiler then select the "Save as Trace Collection" option. This will then script out the XML trace definition for you which can then be executed against your SQL Server system... simple as that !
For more information, see the following Webcast. It's well worth taking a look !
Comments
Anonymous
January 01, 2003
(Cross-posted from Vantage Point: Bob German's Weblog ) H1 { FONT-SIZE: medium } Recently Rich CraneAnonymous
January 01, 2003
Recently, I learned from a colleague that it's possible to run the SQL Server 2005 Performance DashboardAnonymous
January 01, 2003
Session 1 - Take Control of the Enterprise: Effective Solutions for Governing your Environment with Policy-BasedAnonymous
January 01, 2003
Многие заказчики иногда сталкиваются с проблемами потери производительности базы данных SQL Server. ПричиныAnonymous
January 01, 2003
I've been looking at this new feature of SQL Server 2008 in order to demo it to customers, and IAnonymous
January 01, 2003
H1 { FONT-SIZE: medium } Many thanks to everyone who attended the MOSS 2007 and SQL 2008 "Better Together"Anonymous
January 01, 2003
During a recent visit to Seattle for a Microsoft TechReady conference, I learned from a colleague thatAnonymous
January 01, 2003
When I look at the question, I feel that no direct answer to it! The reason being SQL Server has outgrownAnonymous
January 29, 2010
Good solid article. The default is 14 days of history. Is there anyway to archive the reports without hanging on to all that data? 14 days may not be enough to see trends or do historical analysis. Thanks!Anonymous
March 10, 2010
How do you get those graphical reports? I get loads of data, no pretty pictures.Anonymous
May 28, 2010
Great post! I love it!Anonymous
June 02, 2010
good articleAnonymous
February 07, 2011
good one.Anonymous
August 21, 2012
this is a great source for me to start creating a perf collection for SQL Farm, Thank you for great post..!