JScript Debugger in Internet Explorer 8 Beta 2
In Internet Explorer 8 Beta 2 JScript team has focused on improving developer productivity. You can read 'What’s new in JScript for IE8 Beta 2' and check out the JScript PM Channel 9 video to learn more. As part of our focus on developer productivity we have continued to invest in the IE8 Developer Tools in IE8 and added a JScript Profiler to the developer tools. You can read 'Introducing the IE8 Developer Tools JScript Profiler' for more details on the profiler. The JScript profiler along with the JScript debugger we introduced in Internet Explorer Beta 1 will help you get your site working correctly and optimally.
In this blog I will give more details about the following key improvements we have made in debugger for beta 2, you can check my JScript Debugger in Internet Explorer 8 Beta 1 blog for more details on the features we released in Beta 1:
- Improved script viewer and script explorer
- More powerful script console
- New execution control features
- Better keyboard navigation and overall usability
One of the goals for the script debugger has been to make sure that debugger has minimal impact on your regular browsing. We made that possible by moving JScript engine to debug mode only when you press start debugging. With this, you no longer need to keep debugging enabled in the Internet Options and thus don’t suffer the performance hit. We also wanted to provide you lot of power even when you are not debugging and ensure that you don’t need to transition to debug mode unless you have to debug. Now with Beta 2 we have added some powerful features to make that possible.
Improvements in Script Viewer
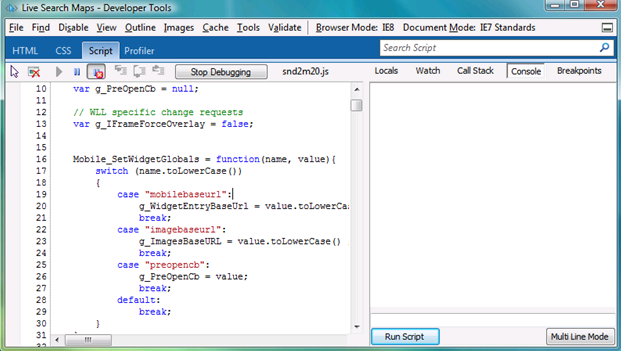
The script viewer in Beta 1 showed all the sources when you are debugging but it only showed source for main page when not debugging. Now with Beta 2 you will be able to browse all the sources even when you are not debugging. You can also set breakpoints even before starting debugging. The breakpoints will persist till you close IE window. To make code easier to read, we have updated the source viewer to show sources in syntax color. This is similar to what you might expect in code editors such as Visual Studio.
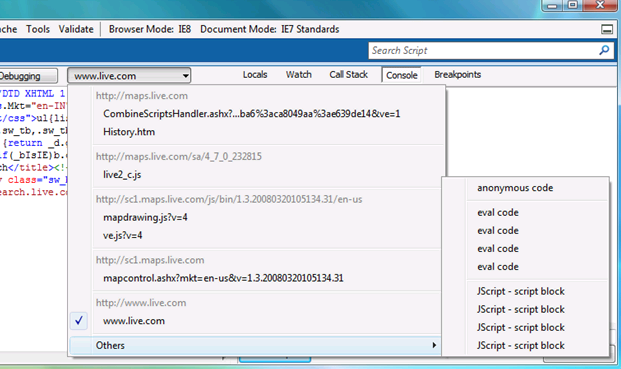
We have also updated the script explorer dropdown to make it easy to browse and select files. Now the script explorer will show the domain to which the script file belongs to. We have also separated the eval code, other dynamic scripts and scripts executed from Console into ‘Others’ submenu of the script explorer. With this change it will be easy for you to find the script file you are looking for.
Updated Script Console
Console panel in the script tab makes it easy for you to try out new scripts. You can execute the scripts in the console irrespective of whether you are debugging or not. In Beta 2 we have improved the look and feel of the Console so that it is easy to read the output.
To make it easy for you to fix errors on your page, Console also logs all the script errors. These errors will be logged in the Console once Developer Tools has been opened for the tab. You can also navigate to the error location in script by clicking on the error hyperlink in the Console.
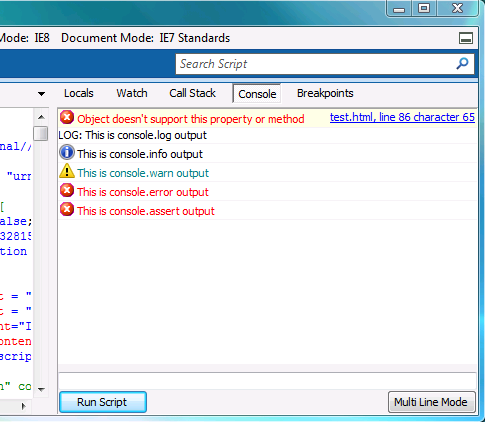
To help you log message to Console from your script source we have added support for ‘console’ object. Developer Tools provides multiple level of logging with console.log() , console.info() , console.warn() , console.error() and console.assert(). Instead of using window.alert for debugging, you can use these console commands to log messages to the Console. You can call these console commands with a list of arguments that will be concatenated to generate the output string. The input parameters can also be formatted by using substitution patterns in the style of printf().
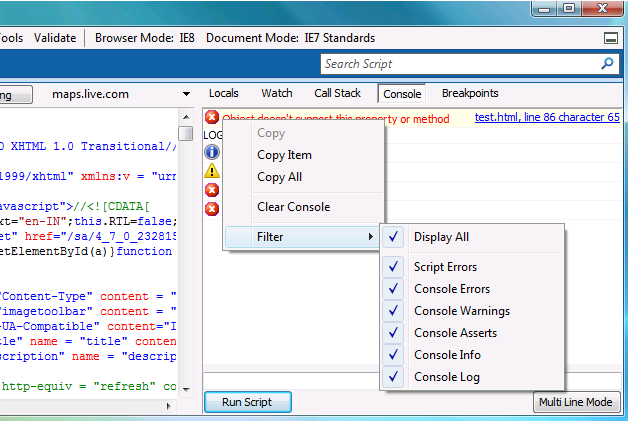
You can also control what messages you want to see in the Console pane by using the context menu. Context menu also provide you option to clear the console of all messages. If you only want to clear console.log messages, you can use console.clear() .
The console.log is extensible and you can add your own console commands through custom scripts. For example you can add console.debug() command which takes string arguments by using following script –
console.debug = function(){
var args = "";
for(var x=0; x<arguments.length; x++)
{
args += arguments[x];
}
console.log("DEBUG: " + args);
}
This can be easily enhanced to take formatted strings.
More execution control features
The Developer Tools in Beta 1 offered execution control features like Break All, Step In, Step Out, Step Over. In Beta 2 we have added support for Conditional Breakpoints and Break on Error. In conditional breakpoint you can give any valid JScript expression to be evaluated and debugger will only halt if the expression evaluates to true. Break on Error provides a toggle switch to control whether debugger will break on JScript runtime error or continue while ignoring the error. Regardless of the toggle state the error will be logged to the console so that you can investigate them at your convenience.
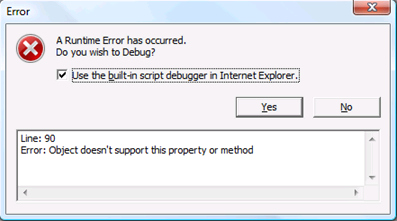
We have also extended the just-in-time debugging experience of Internet Explorer. Although with IE8 you don’t need to keep debugging enabled from Internet Options, still if you have debugging enabled in the IE and you hit a script error, you now get an option to use Developer Tools debugger. You can still use Visual Studio and other stand alone debuggers by unselecting the check-box in the message and clicking on Yes.
Improved Usability
In Beta 2 we have added extensive keyboard shortcuts. If you have been using Visual Studio for debugging script in IE, you already know the keyboard shortcuts! We have kept the keyboard shortcuts as close to Visual Studio as possible. List ofall the keyboard shortcuts supported by JScript Debugger is available here.
We have added search functionality to Developer Tools. Searching in Script tab will show you the search term highlighted in the source viewer. When you browse to a new site or select another file from the source explorer dropdown the search term will continue to be highlighted.
We have also made other improvements like increased tool tips to improve the usability and looks of the debugger.
More Information
For more information on the Developer Tools and JScript Debugger check out these articles:
- Developer Tools: Script Debugging Overview
- Developer Tools: Keyboard Shortcuts
- JScript Debugger in Internet Explorer 8 Beta 1
- Developer Tools in Internet Explorer 8 Beta 2
- Discovering the Internet Explorer 8 Developer Tools
- Internet Explorer 8 Developer Tools GUI Reference
We look forward to your feedback about the debugger so please leave us a comment in this post. Thanks, and enjoy IE8 Beta 2!
Deepak Jain
Program Manager
JScript Team
Comments
Anonymous
September 17, 2008
It has been a while since I blogged here (this is an understatement!). Internet Explorer 8 Beta 2 hasAnonymous
September 17, 2008
The comment has been removedAnonymous
September 17, 2008
The comment has been removedAnonymous
September 17, 2008
This is the best news about IE8 yet! I've been using Bet 2 the past few weeks and these tools are great - and much needed. Thanks!Anonymous
September 17, 2008
It would be very helpful if to use visual studio every time we wanted to debug we didn't have to uncheck the checkbox twice (first time it just goes dim) and then hit no, and then pick our real debugger. Would it be possible to just add the built in one to the platform list so we just have one window (or some preference somewhere so those of us who need to use VS don't have additional clicks and windows to go through each time).Anonymous
September 17, 2008
@fr: Thanks for the feedback. While we will continue improving the developer experience in case of error, in the meanwhile have you tried the Console in script tab of Developer Tools. It provides you link to the error location and you can easily browse the source code at that location.Anonymous
September 17, 2008
@Mitch: Thanks for your feedback. The checkbox having three states is a bug and we will fix this in the next release. We will also work on improving the JIT experience for Visual Studio developers.Anonymous
September 18, 2008
As you might be aware that Internet Explorer Beta 2 was released few weeks back. In this JScript teamAnonymous
September 19, 2008
Isn't arguments object deprecated?Anonymous
September 19, 2008
The comment has been removedAnonymous
September 21, 2008
This looks really nice. Unfortunately, I do almost all of my JScript programming away from the web. I've integrated the Windows Scripting Host into an application UI that I'm working on, so that various elements will be controllable via script. Debugging these scripts has turned out to be a real chore, though, and I need a way to step through them in a real debugger. Is it possible to use this same IE8 debugger on non-web scripts?Anonymous
September 22, 2008
@Paul: The IE8 debugger is only targeted at webpages. You can try using the Express edition of Visual Studio which is available for free at http://www.microsoft.com/express/download/Anonymous
September 22, 2008
@Bill: Thanks for answering the argument question. We have tested the debugger on large files but haven't encountered this problem. I will contact you offline to get the repro.Anonymous
September 23, 2008
The debugger is a valuable addition to IE, if only for one thing. I spend less time looking up and/or guessing IE's idiosyncrasies. It also correctly indicates where the "error" (or more commonly, bug triggerer) is located (there is often a 2-3 lines offset in IE6/7's script error reports). About that though, what the heck is 'param's'? I tried using it as a custom property for an object I created, all browsers went along with it, but IE shouted at me that it can't accept this object or method. I solved the bug by changing my property's name, but I couldn't find anything conclusive on MSDN (and I admit, I gave up after I got my third "ASP.net has returned an error: this service isn't available" in a row). I'd like to ask a slightly OT question, one that didn't get answered and not even commented on the IE blog, though. Is there anything planned for the 'event' object?Anonymous
September 27, 2008
Is there any way to control the keyword coloring in the dev tools. It would be awesome if it directly uses VS colorization settings if VS is installed.Anonymous
October 01, 2008
@Soum: The colors used for the syntax coloring are VS default. Developer Tools doesn't provide options to change these colors.Anonymous
October 01, 2008
@Mitch 74: Can you share some more details about your issue. If you can share a sample it will help us in getting to the root of the issue. You can send us mail using the email link at upper left corner of this blog.Anonymous
October 08, 2008
The comment has been removedAnonymous
October 30, 2008
Beidzot esmu saņēmies un gatavs ielikt papildus informāciju no savas prezentācijas par jaunajām IE8 iespējāmAnonymous
November 01, 2008
To access the Console window the keyboard shortcut is F12 (for Developer Tools) and CTRL + 3 (to jump to the Script tab which is third in the tab list) and then CTRL + ALT + I to go to the Console window. Can we have something simpler - just 2 steps, F12 + some other Function key, maybe?Anonymous
December 19, 2008
I have a serious problem with script debugger stopping browsing every 5 seconds. How do I shut it off--would appreciate specifics. Thanks, Karchmer_clifford@bah.comAnonymous
December 19, 2008
I have a serious problem with script debugger stopping browsing every 5 seconds. How do I shut it off--would appreciate specifics. Thanks, Karchmer_clifford@bah.comAnonymous
December 23, 2008
Using your debug tool, I've found that this method { defineGetter(propname, pdispHandler) } is defined on XMLHttpRequest, and that the method seems to works really well. But others objects seems doesn't have this method implemented. So, will this method be part of IE8 or not ? Another thing, will the whole JScript Engine be really faster than the previous one, or were there only specifics features optimised ? Last thing : Have you ever thought about pre-compilation of JS ? It's a Google's idea that I had already before they done it, and I think it's a great way to make JS faster.Anonymous
January 30, 2009
Omg! They took everything from Firebug!Anonymous
February 23, 2009
Sorry for the delay in responding to these @Simone: We have been working on making of the performance of the Script debugger better. Let us know if you have a better experience in the IE8 RC release. @Anil: Thanks for your feedback. We would consider this for the next release. @C Kramcher: I would ping you offline to get details @FremyCompany: Yes, for IE8, the accessor methods in JScript have been enabled for DOM objects. You could read more about the same at Document Object Model Prototypes, Part 2: Accessor (getter/setter) Support - http://msdn.microsoft.com/en-us/library/dd229916(VS.85).aspx Thanks GauravS[MSFT]Anonymous
March 25, 2009
During Beta1 and Beta2 pre-releases of IE8, we’ve blogged about the performance optimizations done inAnonymous
March 25, 2009
During Beta1 and Beta2 pre-releases of IE8, we’ve blogged about the performance optimizations done inAnonymous
June 25, 2009
The developer tools are extremely painful to use for javascript heavy applications. I develop SearchCenter for Omniture and to turn on debugging, I have to wait minutes. Then I have to refresh the page to see the error which results in more minutes to wait. And then, to see if I fixed the error, I have to turn of debugging (and wait minutes), turn on debugging (and wait minutes) and then refresh the page (I do this because I can't seem to refresh the page while the debugger is stopped at an error). All in all, it is wonderful to have this functionality but it is so painful to use. So, could you please speed it up? The html viewer is also just as slow.Anonymous
August 07, 2009
I also find the debugger extremely useful but at the same time unimaginably slow. It takes 3 minutes to load my script, the same for switching to debugging, etc, etc. every small step, IE8 runs at 100% CPU for MINUTES. I have a strong suspicion someone needs to take a look at the JavaScript syntax coloring algorithm. I think it is exponentially related to script length. Probably someone is doing a for loop and adding one character at a time to a String?Anonymous
August 07, 2009
@Trevan, Chris Laffra: Thanks for your feedback! We are working towards improving the performance of the script debugger.Anonymous
November 12, 2009
Also came here to echo the performance of debugging large files (like ext-js-debug.js). It's very nearly unusable with the current performance. I use Firefox and Firebug for the "serious" part of development because Firebug is so much faster and feature-rich than the current IE developer tool. The specific features I use on a constant basis are: Console tab. Show the requests that are being made with the various attributes like Headers, Post, and Response. I also like the response codes and timing. Console tab. Being able to explore an object with the command "console.log(object)". Also, the watch tab on variables doesn't show available functions for an object. At least for ExtJS, I find it invaluable to "hunt" for function references their documentation doesn't directly mention. But really, the performance of trying to debug large files is a killer. If you have even a beta (or even alpha!) version that improves performance, I know I'd test it in a heartbeat!