VS2010 SP1: Silverlight 4 profiling from Visual Studio UI
If you install recently published VS2010 SP1 Beta, you can discover that VS Profiler team enriched Silverlight profiling user experience. Previously I published few posts about VS2010 usage for those purposes, either through VS Profiler command line tools or VS2010 UI. Both approaches led you to the final results or figuring out the bottlenecks of your Silverlight application, but they require number of manual steps to be done.
In VS2010 SP1 however Silverlight projects are fully recognized by VS Profiler, and you can conduct your performance investigations much easier.
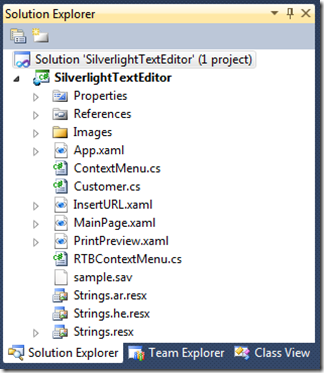
For example, you might use the Silverlight Text Editor Sample, and open this project in VS2010 SP1:
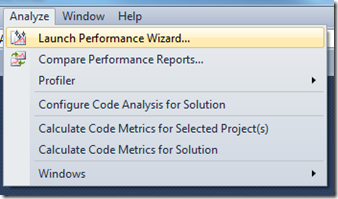
Now, if you wish to create a performance session for this project, you can do it in a usual way through Performance Wizard:
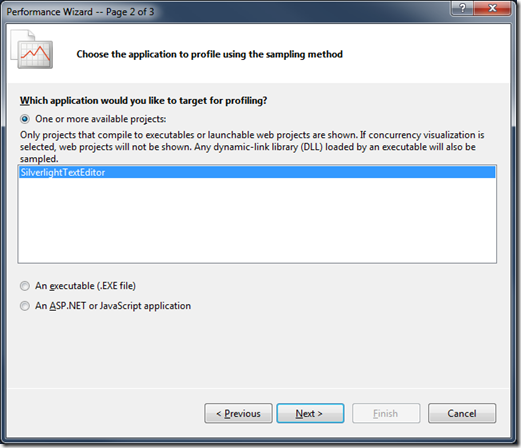
You will see your project in the list of possible targets (it was not there before the final integration of Silverlight projects and VS Profiler), and you can select it there and proceed with the Wizard that creates and starts a performance session for you:
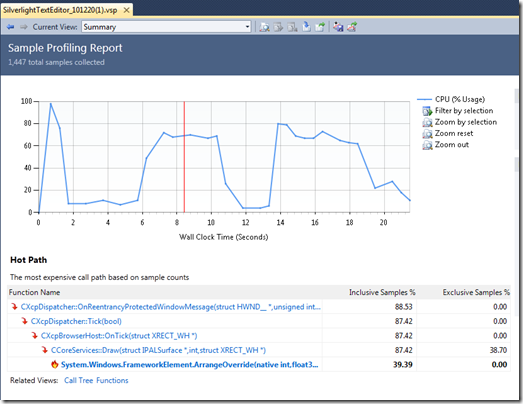
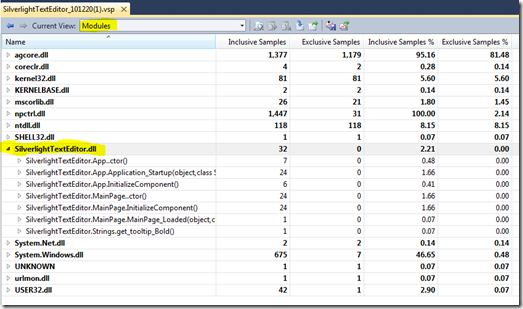
When you close your application – the session is over and profiling results are presented so you can analyze the data:
Enjoy!
Comments
Anonymous
December 21, 2010
Any ways profiling Silverlight application hosted by an asp.net web site?Anonymous
January 26, 2011
I have the same scenarios as Denis. My app is hosted in an asp.net website and it seems that I am unable to profile as well. Any help would be appreciated...Anonymous
February 09, 2011
Please see the following blog post detailing how to do this blogs.msdn.com/.../how-to-profile-asp-net-and-silverlight-at-the-same-time.aspx
