Log query scope and time range in Azure Monitor Log Analytics
When you run a log query in Log Analytics in the Azure portal, the set of data evaluated by the query depends on the scope and the time range that you select. This article describes the scope and time range and how you can set each depending on your requirements. It also describes the behavior of different types of scopes.
You must have Microsoft.OperationalInsights/workspaces/query/*/read permissions to the Log Analytics workspaces you query, as provided by the Log Analytics Reader built-in role, for example.
The query scope defines the records that the query evaluates. This definition will usually include all records in a single Log Analytics workspace or Application Insights application. Log Analytics also allows you to set a scope for a particular monitored Azure resource. This allows a resource owner to focus only on their data, even if that resource writes to multiple workspaces.
The scope is always displayed at the top left of the Log Analytics window. An icon indicates whether the scope is a Log Analytics workspace or an Application Insights application. No icon indicates another Azure resource.
The method you use to start Log Analytics determines the scope, and in some cases you can change the scope by clicking on it. The following table lists the different types of scope used and different details for each.
Important
If you're using a workspace-based application in Application Insights, then its data is stored in a Log Analytics workspace with all other log data. For backward compatibility you will get the classic Application Insights experience when you select the application as your scope. To see this data in the Log Analytics workspace, set the scope to the workspace.
| Query scope | Records in scope | How to select | Changing Scope |
|---|---|---|---|
| Log Analytics workspace | All records in the Log Analytics workspace. | Select Logs from the Azure Monitor menu or the Log Analytics workspaces menu. | Can change scope to any other resource type. |
| Application Insights application | All records in the Application Insights application. | Select Logs from the Application Insights menu for the application. | Can only change scope to another Application Insights application. |
| Resource group | Records created by all resources in the resource group. Can include data from multiple Log Analytics workspaces. | Select Logs from the resource group menu. | Can't change scope. |
| Subscription | Records created by all resources in the subscription. Can include data from multiple Log Analytics workspaces. | Select Logs from the subscription menu. | Can't change scope. |
| Other Azure resources | Records created by the resource. Can include data from multiple Log Analytics workspaces. | Select Logs from the resource menu. OR Select Logs from the Azure Monitor menu and then select a new scope. |
Can only change scope to same resource type. |
When the query scope is a Log Analytics workspace or an Application Insights application, all options in the portal and all query commands are available. When scoped to a resource though, the following options in the portal not available because they're associated with a single workspace or application:
- Save
- Query explorer
- New alert rule
You can't use the following commands in a query when scoped to a resource since the query scope already includes any workspaces with data for that resource or set of resources:
Setting the scope to a resource or set of resources is a powerful feature of Log Analytics since it allows you to automatically consolidate distributed data in a single query. It can significantly affect performance though if data needs to be retrieved from workspaces across multiple Azure regions.
Log Analytics helps protect against excessive overhead from queries that span workspaces in multiple regions by issuing a warning or error when a certain number of regions are being used. Your query receives a warning if the scope includes workspaces in 5 or more regions. it will still run, but it might take excessive time to complete.
Your query will be blocked from running if the scope includes workspaces in 20 or more regions. In this case, you'll be prompted to reduce the number of workspace regions and attempt to run the query again. The dropdown will display all of the regions in the scope of the query, and you should reduce the number of regions before attempting to run the query again.
The time range specifies the set of records that are evaluated for the query based on when the record was created. This is defined by the TimeGenerated column on every record in the workspace or application as specified in the following table. For a classic Application Insights application, the timestamp column is used for the time range.
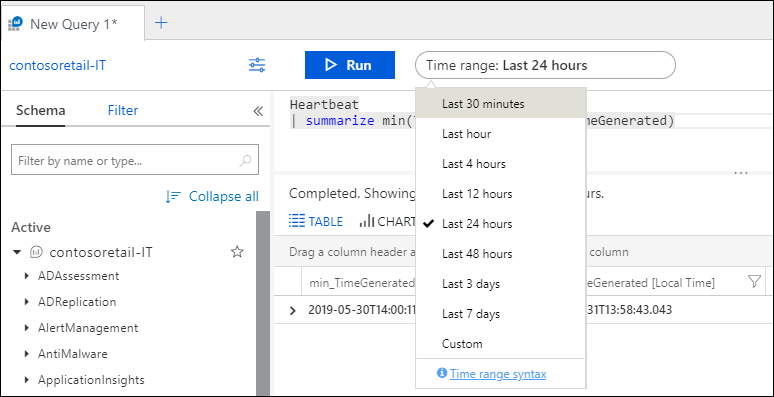
Set the time range by selecting it from the time picker at the top of the Log Analytics window. You can select a predefined period or select Custom to specify a specific time range.
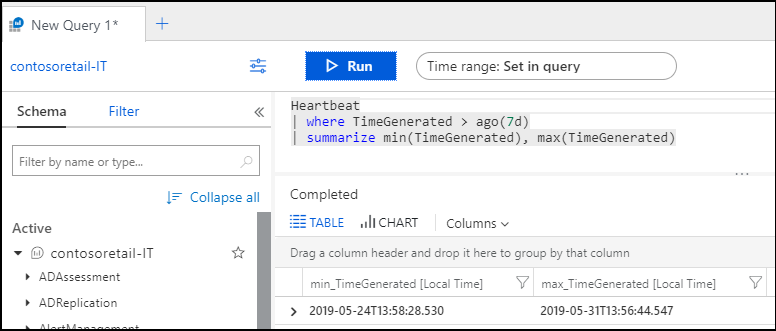
If you set a filter in the query that uses the standard time column as shown in the table above, the time picker changes to Set in query, and the time picker is disabled. In this case, it's most efficient to put the filter at the top of the query so that any subsequent processing only needs to work with the filtered records.
If you use the workspace or app command to retrieve data from another workspace or classic application, the time picker might behave differently. If the scope is a Log Analytics workspace and you use app, or if the scope is a classic Application Insights application and you use workspace, then Log Analytics might not understand that the column used in the filter should determine the time filter.
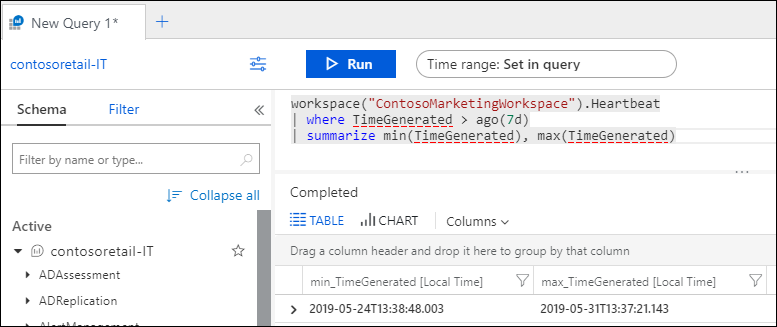
In the following example, the scope is set to a Log Analytics workspace. The query uses workspace to retrieve data from another Log Analytics workspace. The time picker changes to Set in query because it sees a filter that uses the expected TimeGenerated column.
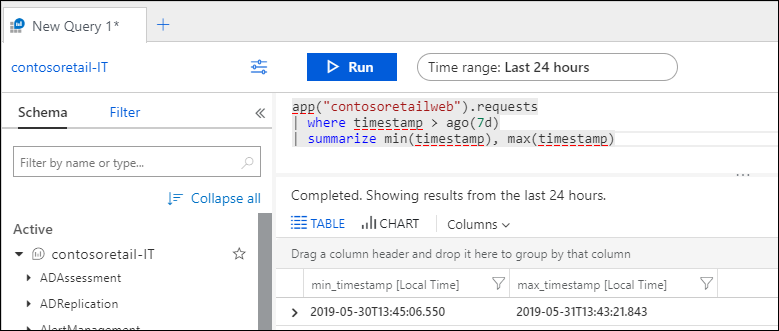
If the query uses app to retrieve data from a classic Application Insights application though, Log Analytics doesn't recognize the timestamp column in the filter, and the time picker remains unchanged. In this case, both filters are applied. In the example, only records created in the last 24 hours are included in the query even though it specifies 7 days in the where clause.
- Walk through a tutorial on using Log Analytics in the Azure portal.
- Walk through a tutorial on writing queries.


