Using Azure Firewall Workbooks
Azure Firewall Workbook provides a flexible canvas for Azure Firewall data analysis. You can use it to create rich visual reports within the Azure portal. You can tap into multiple Firewalls deployed across Azure, and combine them into unified interactive experiences.
You can gain insights into Azure Firewall events, learn about your application and network rules, and see statistics for firewall activities across URLs, ports, and addresses. Azure Firewall Workbook allows you to filter your firewalls and resource groups, and dynamically filter per category with easy to read data sets when investigating an issue in your logs.
Before you start, enable Azure Structured Firewall Logs through the Azure portal.
Important
All the following sections are valid for Firewall structured logs only.
If you want to use legacy logs, you can enable diagnostic logging using the Azure portal. Then go to GitHub Workbook for Azure Firewall and follow the instructions on the page.
Also, read Azure Firewall logs and metrics for an overview of the diagnostics logs and metrics available for Azure Firewall.
Once you've set up Firewall structured logs, you're all set to use the Azure Firewall embedded workbooks using the following steps:
In the portal, navigate to your Azure Firewall resource.
Under Monitoring, select Workbooks.
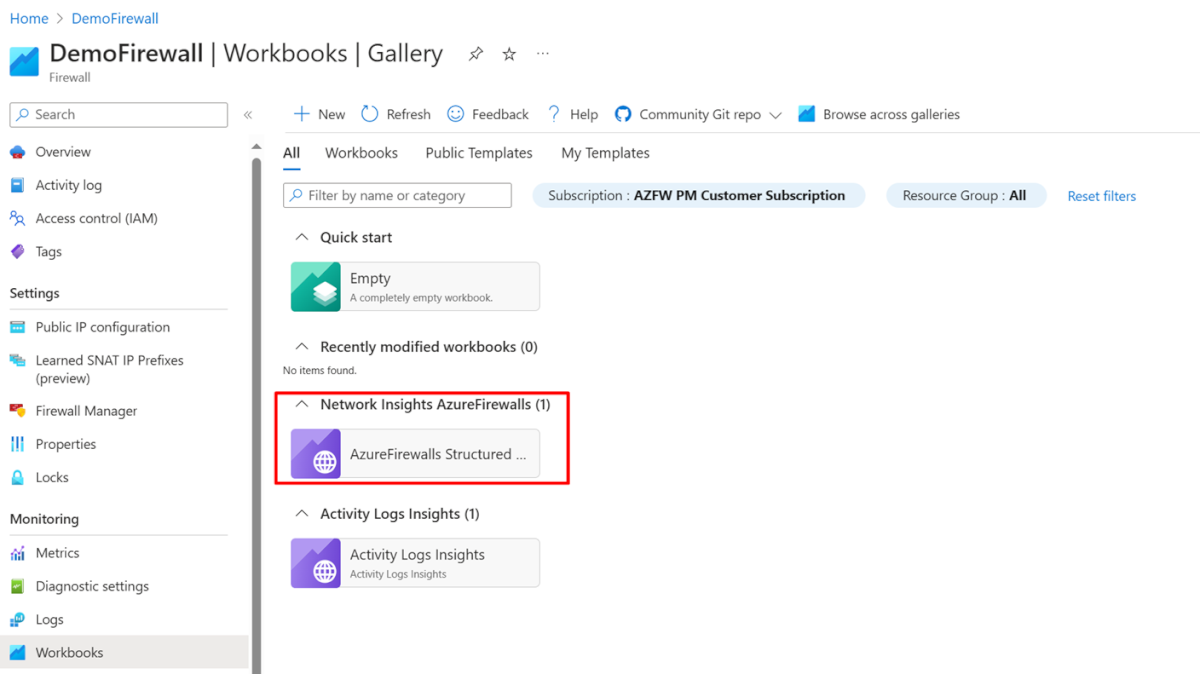
In the Gallery, you can create new workbooks or use the existing Azure Firewall workbook as shown here:
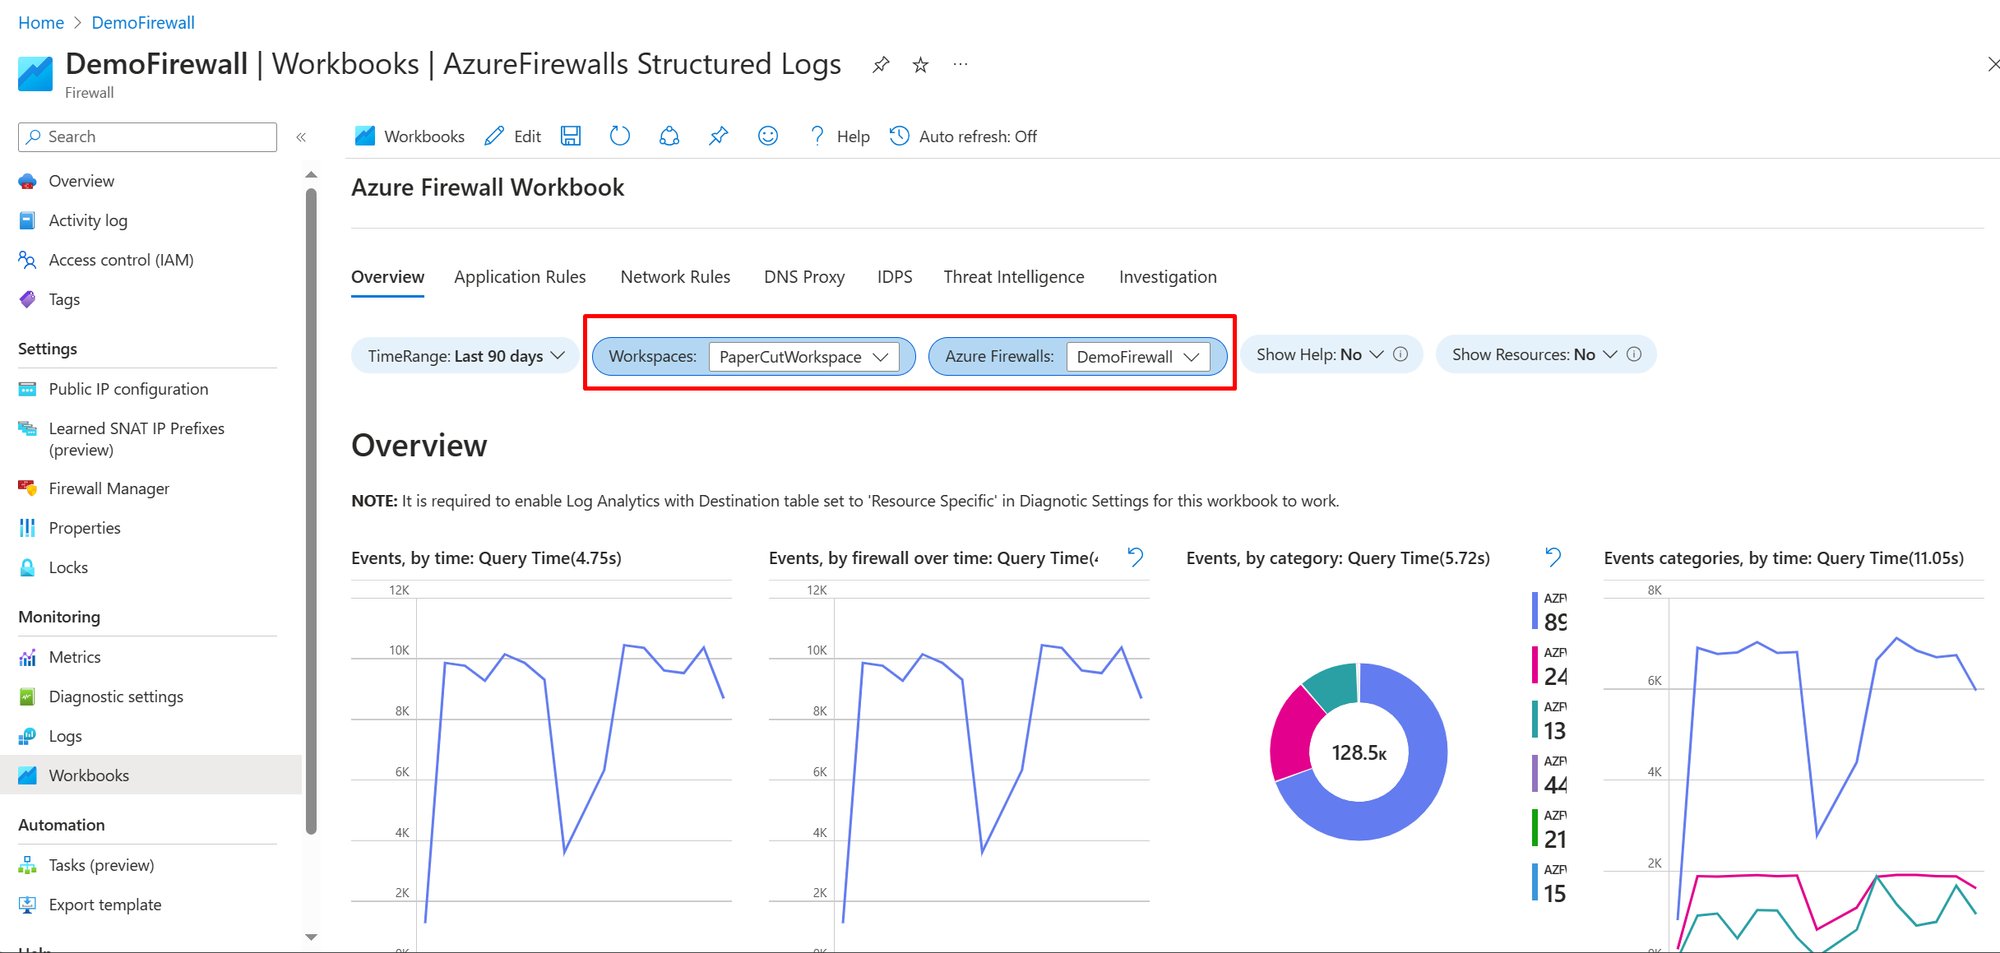
Select the log analytics workspace and one or more firewall names you want to use in this workbook as shown here:
The Azure Firewall workbook has seven tabs, each addressing distinct aspects of the service. The following sections describe each tab.
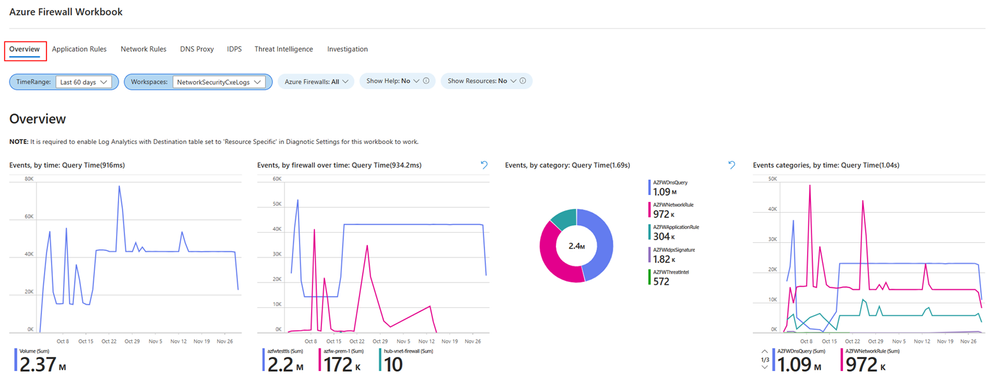
The overview tab showcases graphs and statistics related to all types of firewall events aggregated from various logging categories. This includes network rules, application rules, DNS, Intrusion Detection and Prevention System (IDPS), Threat Intelligence, and more. The available widgets in Overview tab include:
- Events, by time: Displays event frequency over time.
- Events, by firewall over time: Shows event distribution across firewalls over time.
- Events, by category: Categorizes and counts events.
- Events categories, by time: Displays event categories over time.
- Average throughput of firewall traffic: Shows average data passing through the firewall.
- SNAT Port Utilization: Displays usage of SNAT ports.
- Network Rule Hit count (SUM): Counts network rule triggers.
- Application Rule Hit count (SUM): Counts application rule triggers.
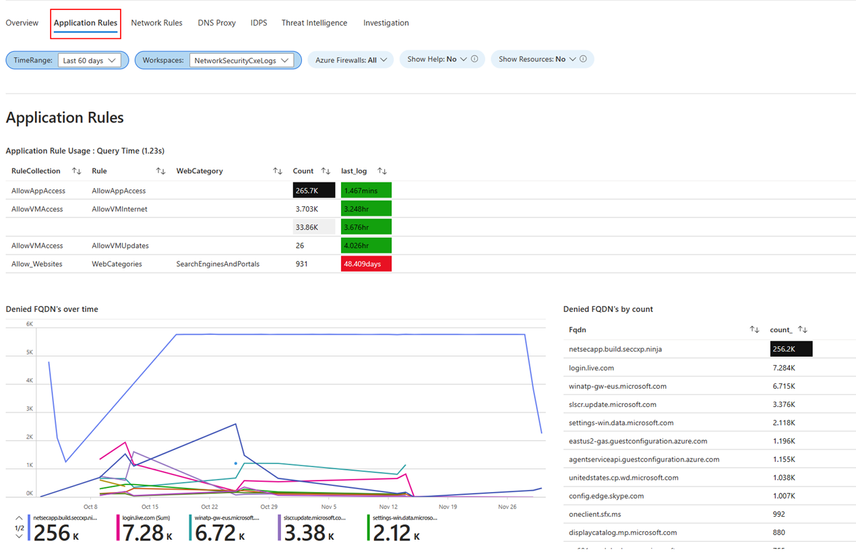
The Application rules tab shows Layer 7 related events statistics correlated with your specific application rules in Azure Firewall policy. The following widgets are available in the Application rules tab:
- Application Rule Usage: Shows usage of application rules.
- Denied FQDN's overtime: Displays denied Fully Qualified Domain Names (FQDNs) over time.
- Denied FQDN's by count: Counts denied FQDNs.
- Allowed FQDN's overtime: Displays allowed FQDNs over time.
- Allowed FQDN's by count: Counts allowed FQDNs.
- Allowed Web Categories overtime: Shows allowed web categories over time.
- Allowed Web Categories by count: Counts allowed web categories.
- Denied Web Categories overtime: Displays denied web categories over time.
- Denied Web Categories by count: Counts denied web categories.
The Network rules tab shows Layer 4 related events statistics correlated with your specific network rules in Azure Firewall policy. The following widgets are available in the Network rules tab:
- Rule actions: Displays actions taken by rules.
- Target ports: Shows targeted ports in network traffic.
- DNAT actions: Displays actions of Destination Network Address Translation (DNAT).
- GeoLocation: Shows geographical locations involved in network traffic.
- Rule actions, by IP addresses: Displays rule actions categorized by IP addresses.
- Target ports, by Source IP: Shows targeted ports categorized by source IP addresses.
- DNAT'ed over time: Displays DNAT actions over time.
- GeoLocation over time: Shows geographical locations involved in network traffic over time.
- Actions, by time: Displays network actions over time.
- All IP addresses events with GeoLocation: Shows all events involving IP addresses, categorized by geographical location.
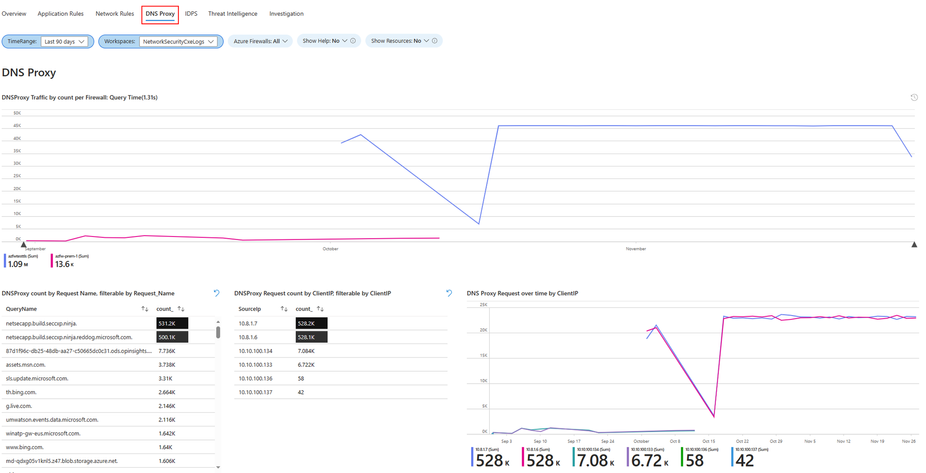
This tab is relevant if you've set up Azure Firewall to function as a DNS proxy, serving as an intermediary for DNS requests from client virtual machines to a DNS server. The DNS Proxy tab includes various widgets that you can use:
- DNS Proxy Traffic by count per Firewall: Displays DNS proxy traffic count for each firewall.
- DNS Proxy count by Request Name: Counts DNS proxy requests by request name.
- DNS Proxy Request count by Client IP: Counts DNS proxy requests by client IP address.
- DNS Proxy Request over time by Client IP: Displays DNS proxy requests over time, categorized by client IP.
- DNS Proxy Information: Provides log information related to your DNS proxy setup.
The IDPS log statistics tab offers a summary of malicious traffic events and the preventive actions undertaken by the service. In the IDPS tab, you'll find various widgets that you can use:
- IDPS Actions Count: Counts IDPS actions.
- IDPS Protocol Count: Counts protocols detected by IDPS.
- IDPS SignatureID Count: Counts IDPS detections by signature ID.
- IDPS SourceIP Count: Counts IDPS detections by source IP address.
- Filtered IDPS Actions by Count: Counts filtered IDPS actions.
- Filtered IDPS Protocols by Count: Counts filtered IDPS protocols.
- Filtered IDPS SignatureIDs by Count: Counts filtered IDPS detections by signature ID.
- Filtered SourceIP: Displays filtered source IPs detected by IDPS.
- Azure Firewall IDPS count over time: Shows Azure Firewall IDPS count over time.
- Azure Firewall IDPS logs with GeoLocation: Provides Azure Firewall IDPS logs, categorized by geographical location.
This tab offers a thorough perspective on threat intelligence activities, spotlighting the most prevalent threats, actions, and protocols. It delineates the top five Fully Qualified Domain Names (FQDNs) and IP addresses associated with these threats, showcasing threat intelligence detections over time. Additionally, detailed logs from Azure Firewall’s Threat Intelligence are furnished for comprehensive analysis. Within the Threat Intelligence tab, you'll find various widgets that you can use:
- Threat Intel Actions Count: Counts actions detected by Threat Intelligence.
- Threat Intel Protocol Count: Counts protocols identified by Threat Intelligence.
- Top 5 FQDN Count: Displays the top five most frequent Fully Qualified Domain Names (FQDNs).
- Top 5 IP Count: Shows the top five most frequent IP addresses.
- Azure Firewall Threat Intel Over Time: Displays Azure Firewall Threat Intelligence detections over time.
- Azure Firewall Threat Intel: Provides logs from Azure Firewall's Threat Intelligence.
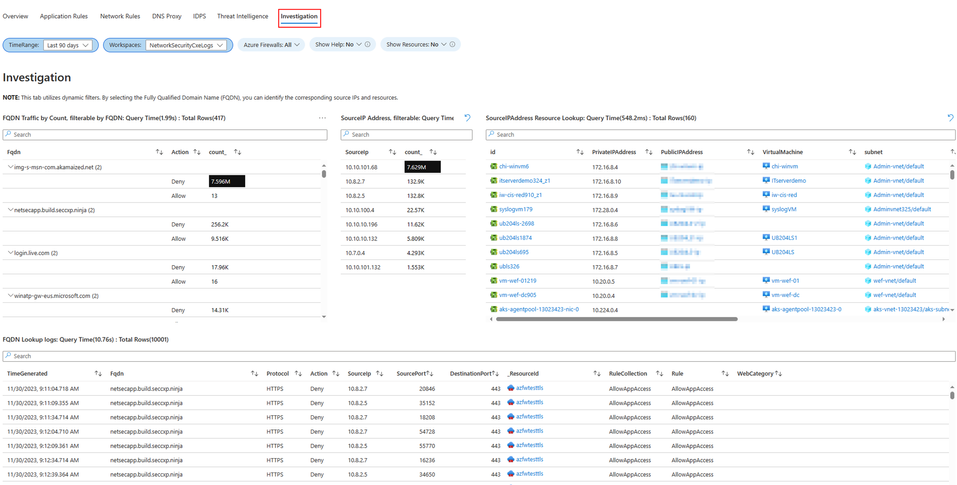
The investigation section enables exploration and troubleshooting, offering additional details such as the virtual machine name and network interface name associated with the initiation or termination of traffic. It also establishes correlations between source IP addresses, the Fully Qualified Domain Names (FQDNs) they attempt to access as well as geographical location view of your traffic. Widgets available in the Investigation tab:
- FQDN Traffic by Count: Counts traffic by Fully Qualified Domain Names (FQDNs).
- Source IP Address count: Counts occurrences of source IP addresses.
- Source IP Address Resource Lookup: Looks up resources associated with source IP addresses.
- FQDN Lookup logs: Provides logs from FQDN lookups.
- Azure Firewall Premium with Geo Location – IDPS: Displays Azure Firewall's Intrusion Detection and Prevention System - (IDPS) - detections, categorized by geographical location.
- Learn more about Azure Firewall Diagnostics
