Monitor your running and completed T-SQL queries using Query activity
Applies to: ![]() SQL analytics endpoint and Warehouse in Microsoft Fabric
SQL analytics endpoint and Warehouse in Microsoft Fabric
Monitoring SQL queries is essential for monitoring and troubleshooting performance of your Fabric warehouse, and also for maintaining the efficiency of the warehouse. With Query activity, you have a one-stop view of all running and historical T-SQL queries along with a list of long-running and frequently run queries without having to run any T-SQL code. You can use Query activity ensure that queries aren't taking longer than expected to execute and are completing successfully.
Prerequisites
- You must be an admin in your workspace to access Query activity. Members, Contributors, Viewers do not have permission to access this view.
Get started
There are two ways you can launch the Query activity experience.
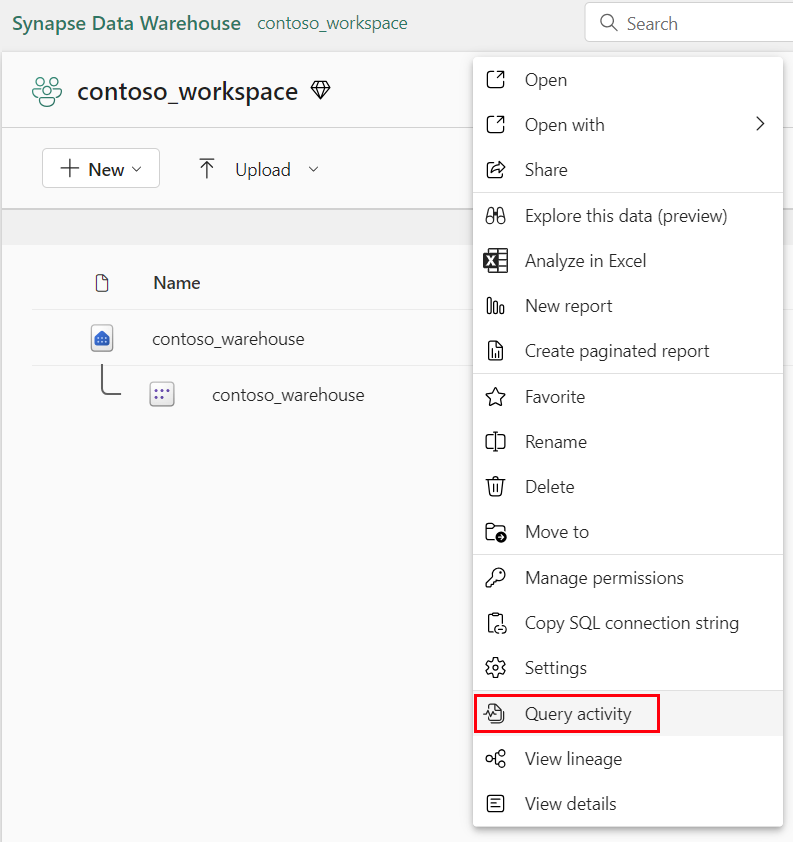
Select More Options (...) next to the warehouse you want to monitor within the workspace view and select Query activity.
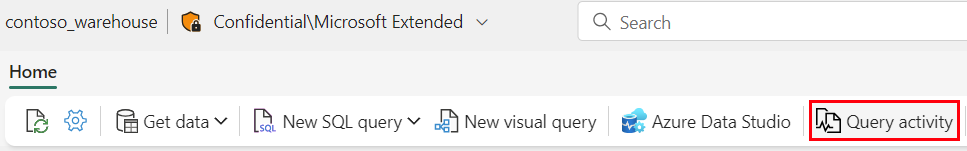
Within the query editor of the warehouse you want to monitor, select Query activity in the ribbon.

Query runs
On the Query runs page, you can see a list of running, succeeded, canceled, and failed queries up to the past 30 days.
- Use the dropdown list to filter for status, submitter, or submit time.
- Use the search bar to filter for specific keywords in the query text or other columns.
For each query, the following details are provided:
| Column name | Description |
|---|---|
| Distributed statement Id | Unique ID for each query |
| Query text | Text of the executed query (up to 8,000 characters) |
| Submit time (UTC) | Timestamp when the request arrived |
| Duration | Time it took for the query to execute |
| Status | Query status (Running, Succeeded, Failed, or Canceled) |
| Submitter | Name of the user or system that sent the query |
| Session Id | ID linking the query to a specific user session |
| Run source | Name of the client program that initiated the session |
When you want to reload the queries that are displayed on the page, select the Refresh button in the ribbon. If you see a query that is running that you would like to immediately stop the execution of, select the query using the checkbox and select the Cancel button. You'll be prompted with a dialog to confirm before the query is canceled. Any unselected queries that are part of the same SQL sessions you select will also be canceled.

The same information regarding running queries can also be found using dynamic management views.
Query insights
On the Query insights page, you can see a list of long running queries and frequently run queries to help determine any trends within your warehouse's queries.
For each query in the Long running queries insight, the following details are provided:
| Column name | Description |
|---|---|
| Query text | Text of the executed query (up to 8,000 characters) |
| Median run duration | Median query execution time (ms) across runs |
| Run count | Total number of times the query was executed |
| Last run duration | Time taken by the last execution (ms) |
| Last run distributed statement ID | Unique ID for the last query execution |
| Last run session ID | Session ID for the last execution |
For each query in the Frequently run queries insight, the following details are provided:
| Column name | Description |
|---|---|
| Query text | Text of the executed query (up to 8,000 characters) |
| Average run duration | Average query execution time (ms) across runs |
| Max duration | Longest query execution time (ms) |
| Min duration | Shortest query execution time (ms) |
| Last run distributed statement ID | Unique ID for the last query execution |
| Run count | Total number of times the query was executed |
| Count of successful runs | Number of successful query executions |
| Count of failed runs | Number of failed query executions |
| Count of canceled runs | Number of canceled query executions |
The same information regarding completed, failed, and canceled queries from Query runs along with aggregated insights can also be found in Query insights in Fabric data warehousing.
Limitations
- Historical queries can take up to 15 minutes to appear in Query activity depending on the concurrent workload being executed.
- Only the top 10,000 rows can be shown in the Query runs and Query insights tabs for the given filter selections.
- An "Invalid object name queryinsights.exec_requests_history" error might occur if Query activity is opened immediately after a new warehouse is created, due to the underlying system views not yet generated. As a workaround, wait two minutes, then refresh the page.
Related content
Feedback
Coming soon: Throughout 2024 we will be phasing out GitHub Issues as the feedback mechanism for content and replacing it with a new feedback system. For more information see: https://aka.ms/ContentUserFeedback.
Submit and view feedback for