Create a Real-Time Dashboard (preview)
A dashboard is a collection of tiles, optionally organized in pages, where each tile has an underlying query and a visual representation. You can natively export Kusto Query Language (KQL) queries to a dashboard as visuals and later modify their underlying queries and visual formatting as needed. In addition to ease of data exploration, this fully integrated dashboard experience provides improved query and visualization performance.
Important
This feature is in preview.
In this article, you learn how to create a new Real-Time Dashboard, add data sources, and add tiles to the dashboard. You also learn how to enable auto refresh, use parameters, and export dashboards.
Important
Your data is secure. Dashboards and dashboard-related metadata about users are encrypted at rest using Microsoft-managed keys.
Prerequisites
- A workspace with a Microsoft Fabric-enabled capacity
- A KQL database with data
Enable tenant settings in the admin portal
Important
This step must be completed by the tenant admin.
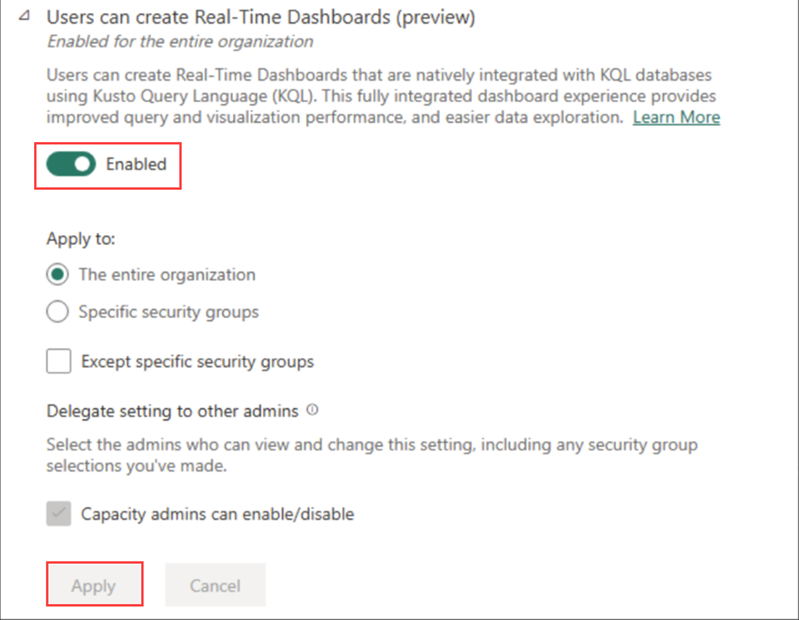
Browse to the admin portal.
In the Tenant settings tab, search for Real-Time Dashboards. For more information, see About tenant settings.
Toggle the button for Create Real-Time Dashboards to Enabled. For more information, see Tenant settings - Microsoft Fabric.
Select Apply.
Create a new dashboard
The Real-Time Dashboard exists within the context of a workspace. A new Real-Time dashboard is always associated with the workspace you're using when you create it.
- Browse to the desired workspace.
- Select +New > Real-Time Dashboard
- Enter a dashboard name and select Create.
A new dashboard is created in your workspace.
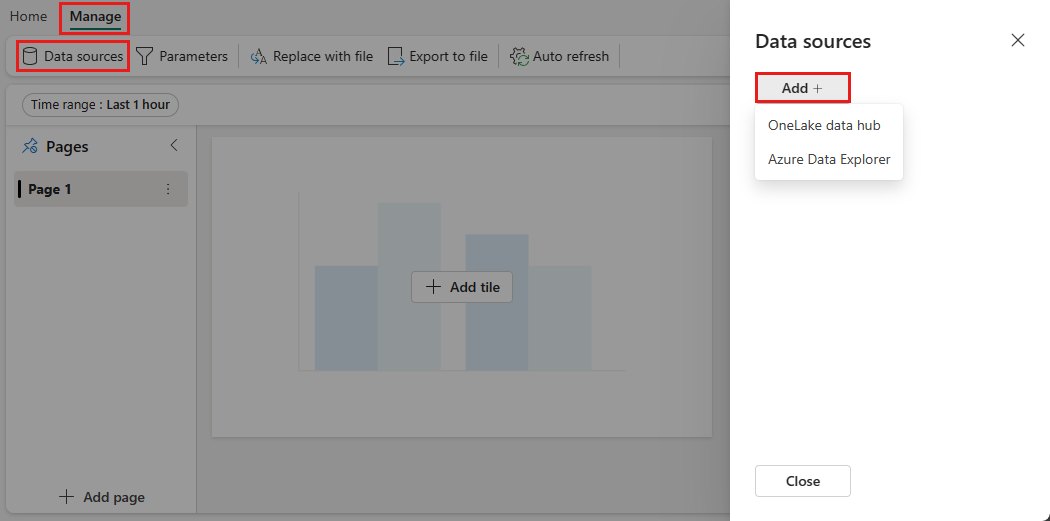
Add data source
Data sources are reusable references to a specific database in the same workspace as the Real-Time Dashboard. Different tiles can be based on different data sources.
Select the Home tab > New data source.
In the Data sources pane, select + Add.
In the Create new data source pane:
- Enter a Data source name.
- Select a Database from the drop-down list.
Select Create.
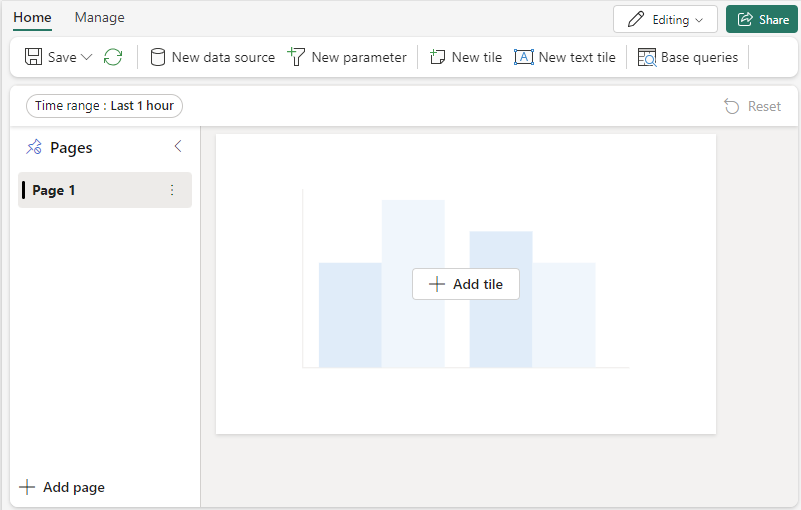
Add tile
Dashboard tiles use Kusto Query Language snippets to retrieve data and render visuals. Each tile/query can support a single visual.
Select Add tile from the dashboard canvas or the top menu bar.
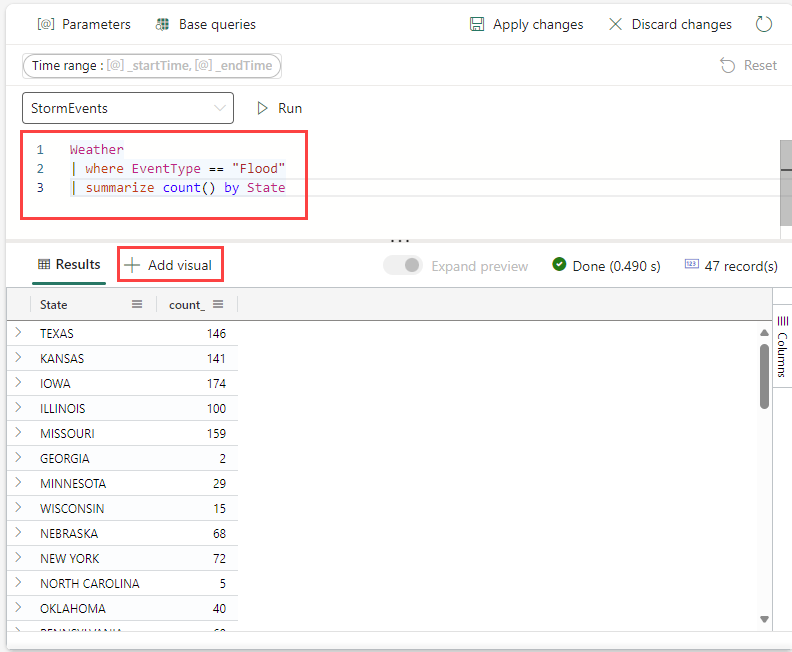
In the Query pane,
Select the data source from the drop-down menu.
Type the query, and the select Run. For more information about generating queries that use parameters, see Use parameters in your query.
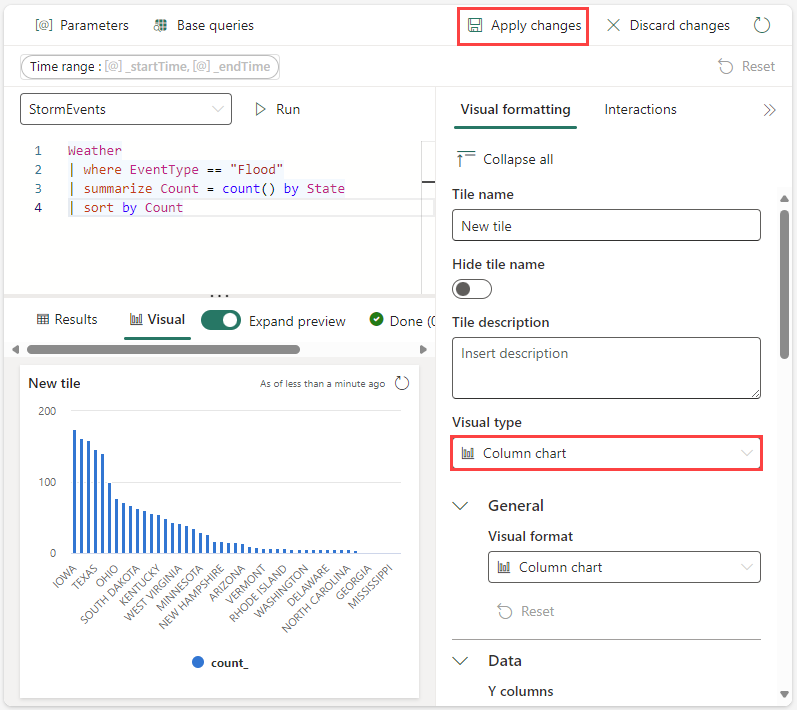
Select + Add visual.
In the Visual formatting tab, select Visual type to choose the type of visual. For more information on how to customize the visual, see Customize Real-Time Dashboard visuals.
Select Apply changes to pin the visual to the dashboard.
Select the Save icon.
Add tile from a queryset
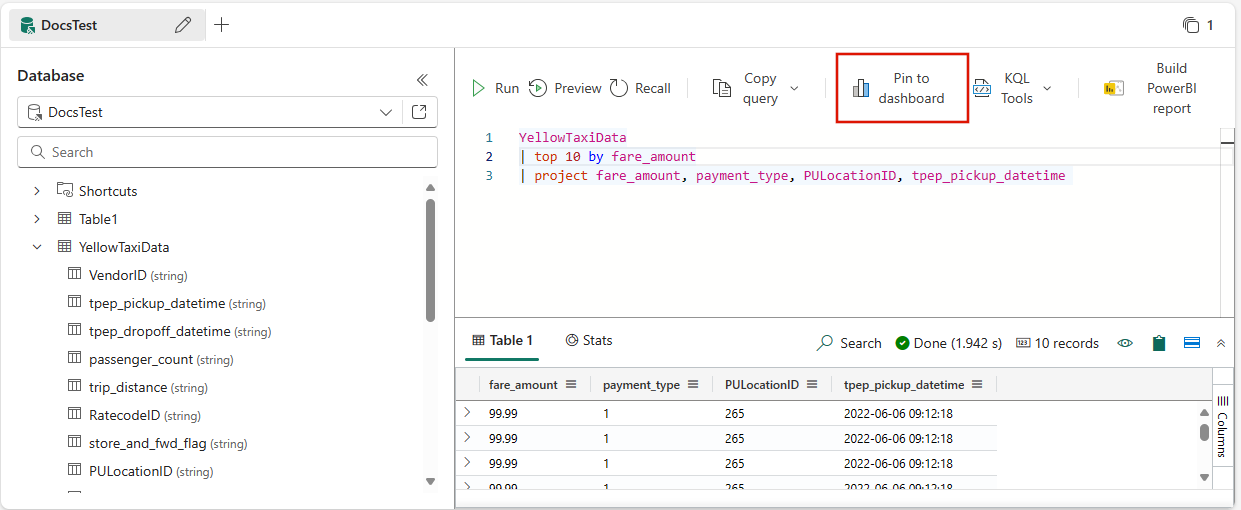
You can add tiles to your dashboard directly from queries written in a KQL queryset.
Select Pin to dashboard.
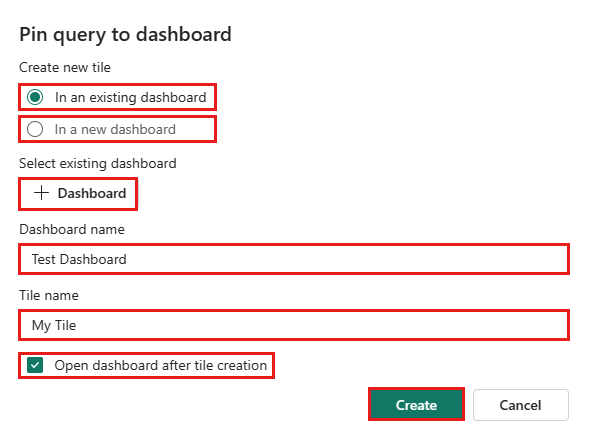
In the Pin query to dashboard window, do the following:
Select an existing dashboard or create a new dashboard.
Name your dashboard tile.
Optionally, select Open dashboard after tile creation to view your dashboard immediately after creation.
Select Create.

Add page
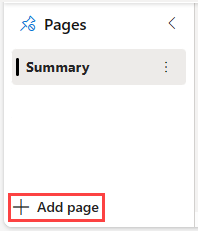
Pages are optional containers for tiles. You can use pages to organize tiles into logical groups, such as by data source or by subject area. You can also use pages to create a dashboard with multiple views, such as a dashboard with a drillthrough from a summary page to a details page.
On the Pages pane, select + Add page.
To name the page, select the vertical More menu [...] > Rename page.
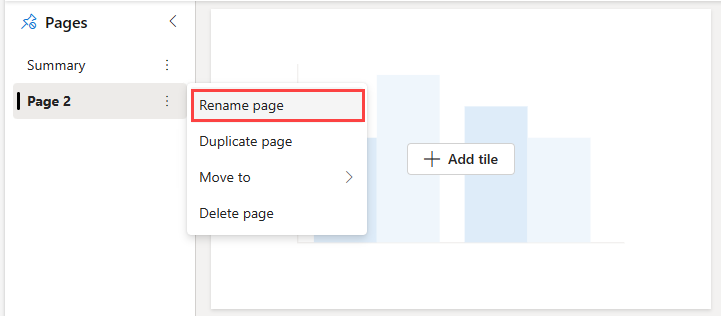
Add tiles to the page.
Use parameters
Parameters significantly improve dashboard rendering performance, and enable you to use filter values as early as possible in the query. Filtering is enabled when the parameter is included in the query associated with your tiles. For more information about how to set up and use different kinds of parameters, see Use parameters in Real-Time Dashboards.
View query
You can view the query in either editing or viewing mode. Editing the underlying query of a tile is only possible in editing mode.
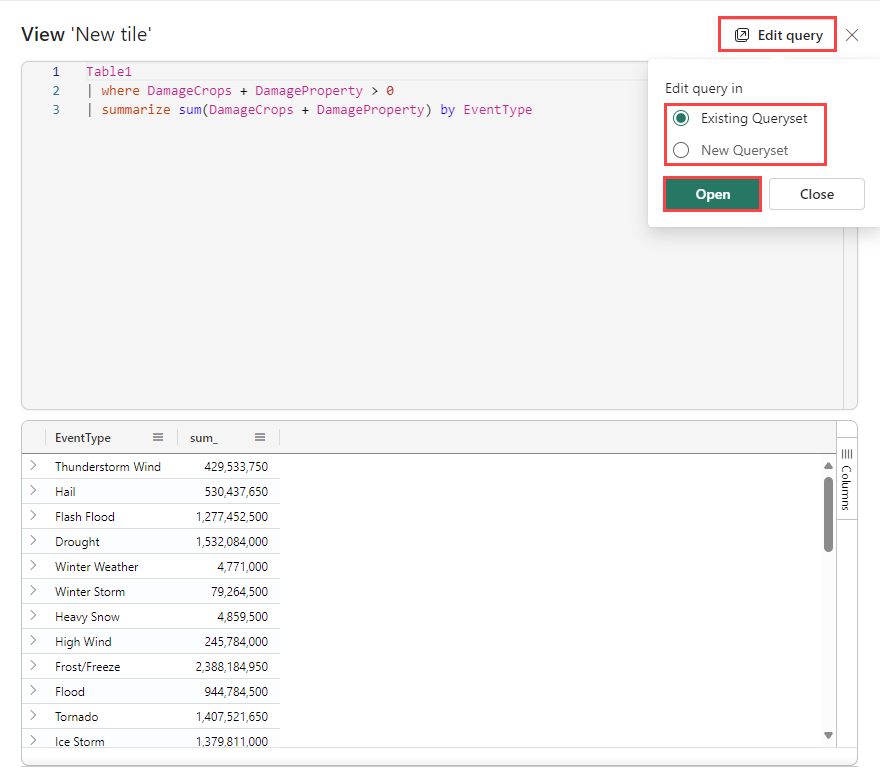
On the tile you want to explore, select the More menu [...] > View query.
A pane opens with the query and results table.
Select Edit query.
Choose either Existing KQL Queryset or New KQL Queryset. Proceed to edit the query in the KQL Queryset.
Note
Any edits made to the query using this flow won't be reflected in the original Real-Time Dashboard.
Enable auto refresh
Auto refresh is a feature that allows you to automatically update the data on a dashboard without manually reloading the page or clicking a refresh button.
The default auto refresh rate can be set by a database editor. Both editors and viewers can change the actual rate of auto refresh while viewing a dashboard.
However, database editors can limit the minimum refresh rate that any viewer can set so as to reduce the cluster load. When the minimum refresh rate is set, database users can't set a refresh rate lower than the minimum.
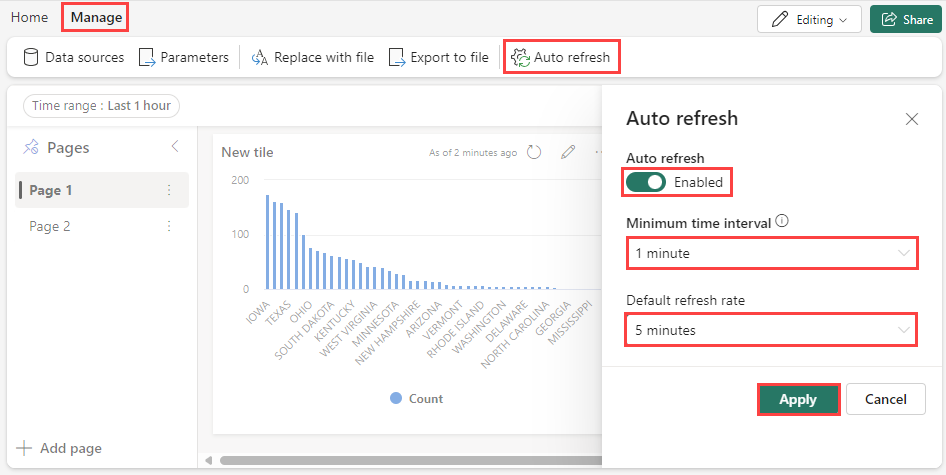
Select the Manage tab > Auto refresh.
Toggle the option so auto refresh is Enabled.
Select values for Minimum time interval and Default refresh rate.
Select Apply and then Save the dashboard.
Share the dashboard
To share the dashboard link: 1. Select Share and then select Copy link 1. In the Dashboard permissions window, select Copy link.
Export dashboards
Use the file menu to export a dashboard to a JSON file. Exporting dashboard can be useful in the following scenarios:
- Version control: You can use the file to restore the dashboard to a previous version.
- Dashboard template: You can use the file as template for creating new dashboards.
- Manual editing: You can edit the file to modify the dashboard. The file can be imported back to the dashboard.
To export a dashboard, in the dashboard, select the Manage tab > |-> Export to file.
The file contains the dashboard data in JSON format, an outline of which is shown in the following snippet.
{
  "id": "{GUID}",
  "eTag": "{TAG}",
  "title": "Dashboard title",
  "tiles": [
    {
      "id": "{GUID}",
      "title": "Tile title",
      "query": "{QUERY}",
      "layout": { "x": 0, "y": 7, "width": 6, "height": 5 },
      "pageId": "{GUID}",
      "visualType": "line",
      "dataSourceId": "{GUID}",
      "visualOptions": {
        "xColumn": { "type": "infer" },
        "yColumns": { "type": "infer" },
        "yAxisMinimumValue": { "type": "infer" },
        "yAxisMaximumValue": { "type": "infer" },
        "seriesColumns": { "type": "infer" },
        "hideLegend": false,
        "xColumnTitle": "",
        "yColumnTitle": "",
        "horizontalLine": "",
        "verticalLine": "",
        "xAxisScale": "linear",
        "yAxisScale": "linear",
        "crossFilterDisabled": false,
        "crossFilter": { "dimensionId": "dragX-timeRange", "parameterId": "{GUID}" },
        "multipleYAxes": {
          "base": { "id": "-1", "columns": [], "label": "", "yAxisMinimumValue": null, "yAxisMaximumValue": null, "yAxisScale": "linear", "horizontalLines": [] },
          "additional": []
        },
        "hideTileTitle": false
      },
      "usedParamVariables": [ "{PARAM}" ]
    }
  ],
  "dataSources": [ {} ],
  "$schema": "https://dataexplorer.azure.com/static/d/schema/20/dashboard.json",
  "autoRefresh": { "enabled": true, "defaultInterval": "15m", "minInterval": "5m" },
  "parameters": [ {} ],
  "pages": [ { "name": "Primary", "id": "{GUID}" } ],
  "schema_version": "20"
}
Update or restore an existing dashboard from a file
You can update an existing dashboard, or restore a previous version, as follows:
- In the dashboard, select the Manage tab > Replace with file.
- Select the file to update the dashboard.
- Select Save.
Related content
Feedback
Coming soon: Throughout 2024 we will be phasing out GitHub Issues as the feedback mechanism for content and replacing it with a new feedback system. For more information see: https://aka.ms/ContentUserFeedback.
Submit and view feedback for