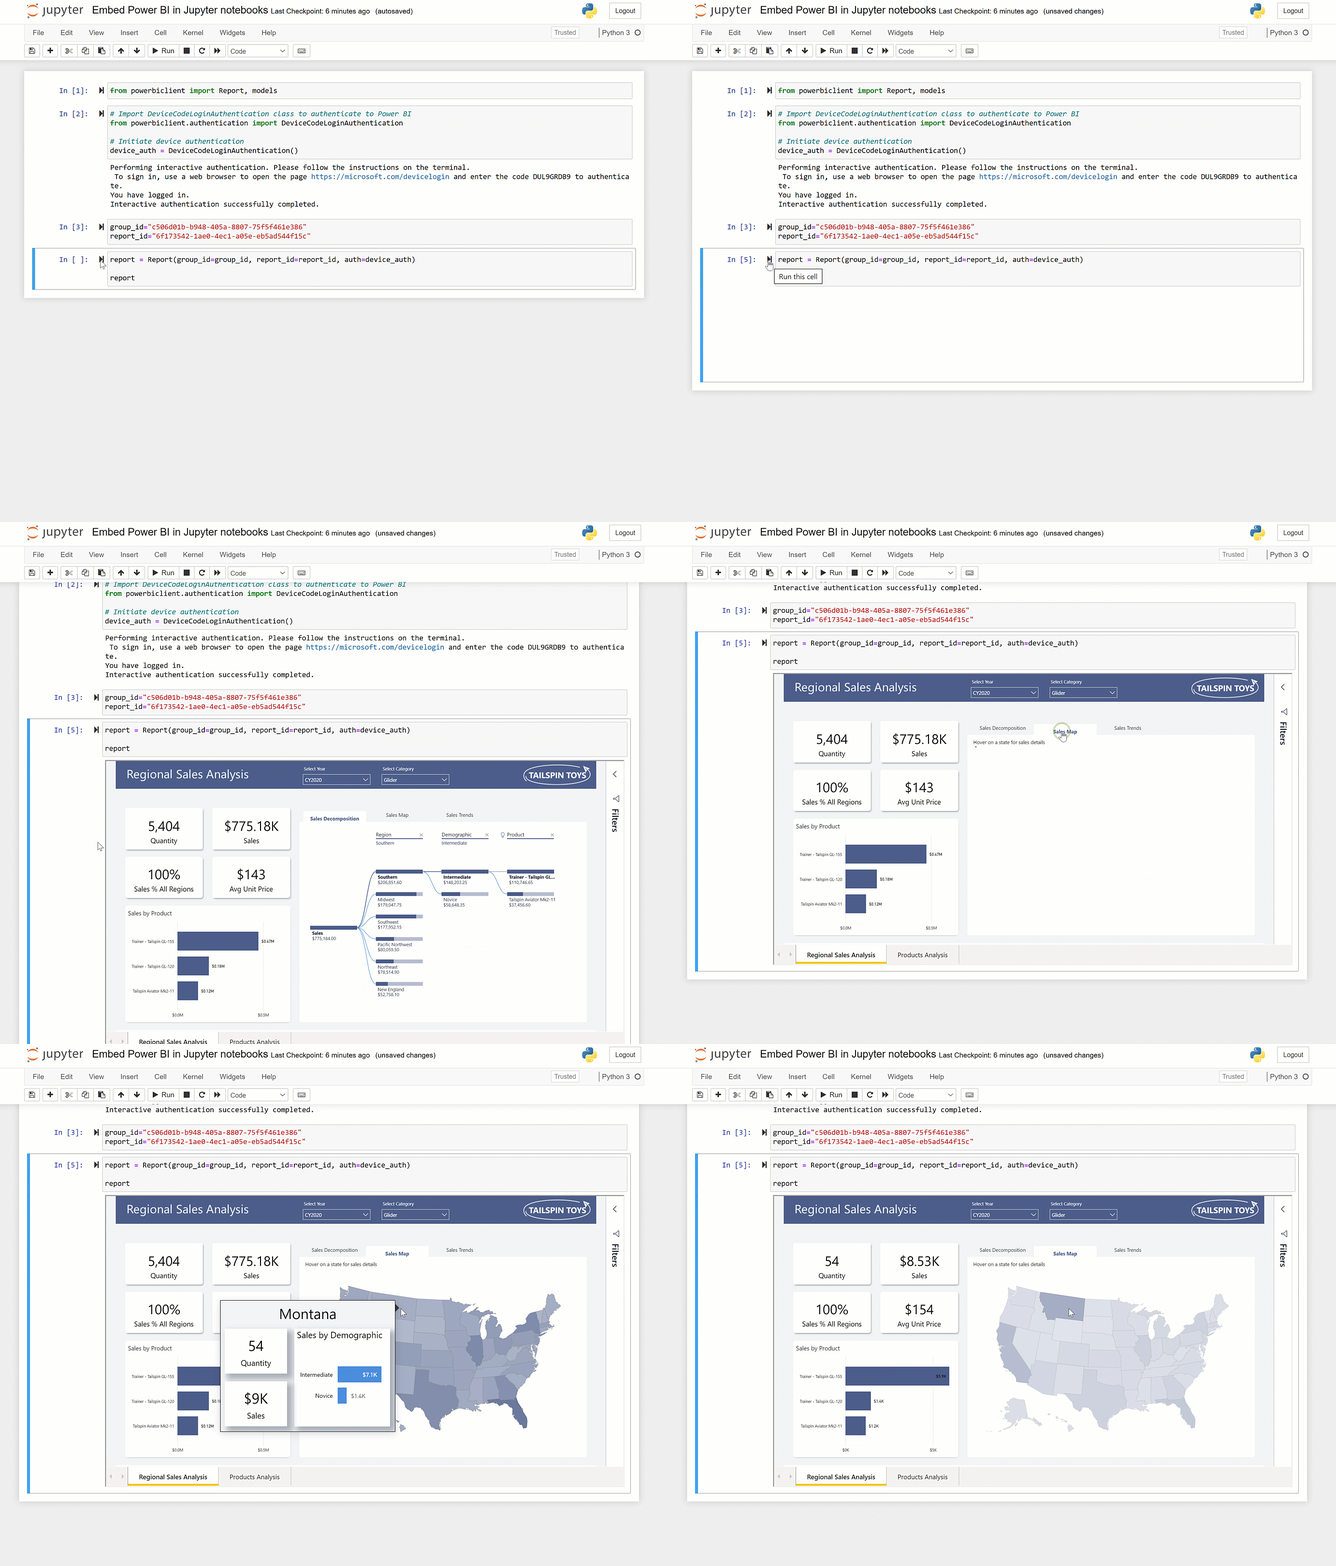
Embed a Power BI component in a Jupyter notebook
The Jupyter notebook makes creating and sharing Power BI reports simple. With Jupyter notebook you can embed or create reports quickly.
The powerbiclient Python package lets you embed Power BI reports in Jupyter notebooks easily. You can export data from visuals in a Power BI report to the Jupyter notebook for in-depth data exploration. You can also filter the report for quick analysis or use bookmarks to apply a saved view.
Install the Power BI Client package
The powerbiclient package can be found on PyPI. It's also open sourced on GitHub.
To install the package you can use pip.
If you are using Jupyter notebook:
pip install powerbiclientIf you are using JupyterLab:
pip install powerbiclient
jupyter labextension install @jupyter-widgets/jupyterlab-manager
If you are using Jupyter Notebook 5.2 or earlier, you may also need to enable the nbextension:
jupyter nbextension enable --py [--sys-prefix|--user|--system] powerbiclient
Embed a Power BI report in a Jupyter notebook

For detailed usage information, see the GitHub wiki.
Embed a report
This example shows how to embed a Power BI report using the package.
Import Report class and models from the package:
from powerbiclient import Report, modelsAuthenticate against Power BI using Azure AD:
# Import the DeviceCodeLoginAuthentication class to authenticate against Power BI
from powerbiclient.authentication import DeviceCodeLoginAuthentication

# Initiate device authentication
device_auth = DeviceCodeLoginAuthentication()
Set the workspace ID and report ID you’d like to embed:
group_id="Workspace ID"
report_id="Report ID"
Create an instance of Power BI report and load the report to the output cell:
report = Report(group_id=group_id, report_id=report_id, auth=device_auth)

report
Run the demo
The GitHub repository includes a demo Jupyter notebook that embeds a user's report. It demonstrates the complete flow of embedding and interacting with Power BI report, including:
- Report event handlers
- Get list of pages
- Get list of visuals
- Export and visualize visual data
- Apply filters
To run the demo:
Make sure you have the following prerequisites:
- pandas
- matplotlib
Run the following commands:
cd demo
jupyter notebook
Run
demo.ipynb.
Quick create a report
You can also easily generate a Power BI quick report from your data in just a few steps. Use any DataFrame in your notebook to quickly transform it into insightful visualizations'. Save the report, if you want, and use it as you would any other report.
For a detailed description, see Quick create a report using Jupyter notebook. For a demo Jupyter notebook, see the GitHub repository.