Create a report quickly in Jupyter notebook
If you're using Jupyter notebook, you can generate Power BI quick-reports in just a few steps without leaving the notebook. A quick report lets you easily tell the story of your data using Power BI's visualization capabilities as part of your notebook experience.
Quick reports are temporary reports that aren't saved automatically. Each time you run the code a new report is created and the old one is removed. You can manually save the report for later use in your notebook or in Power BI.
Prerequisites
To create a report in Jupyter notebook, make sure you have the Power BI client package installed.
Import modules
The following modules are necessary to work with DataFrames in your notebook:
QuickVisualizeandget_dataset_configfrompowerbiclientpandas
from powerbiclient import QuickVisualize, get_dataset_config
import pandas as pd
Create a pandas DataFrame
Create a pandas DataFrame and update it. The following example shows an example of creating a DataFrame from a sample CSV file, but you can create your own DataFrame any way you want.
# Import your own CSV as a pandas data frame
df = pd.read_csv('Financial Sample.csv')

# Perform preprocessing
df = df.drop(['Month Number', 'Month Name', 'Year'], axis=1)
df = df.loc[df['Units Sold'] > 1000]
df['Discounted'] = df['Discount Band'] != 'None'
Authenticate to Power BI
# Import the DeviceCodeLoginAuthentication class to authenticate against Power BI
from powerbiclient.authentication import DeviceCodeLoginAuthentication

# Initiate device authentication
device_auth = DeviceCodeLoginAuthentication()
For more information about authentication, check out the github wiki page.
Create and render a quick visualize instance
Create a QuickVisualize instance from the DataFrame you created. If you're using a pandas DataFrame, you can use our utility function as shown in the following code snippet to create the report. If you're using a DataFrame other than pandas, parse the data yourself.
# Create a Power BI report from your data
PBI_visualize = QuickVisualize(get_dataset_config(df), auth=device_auth)
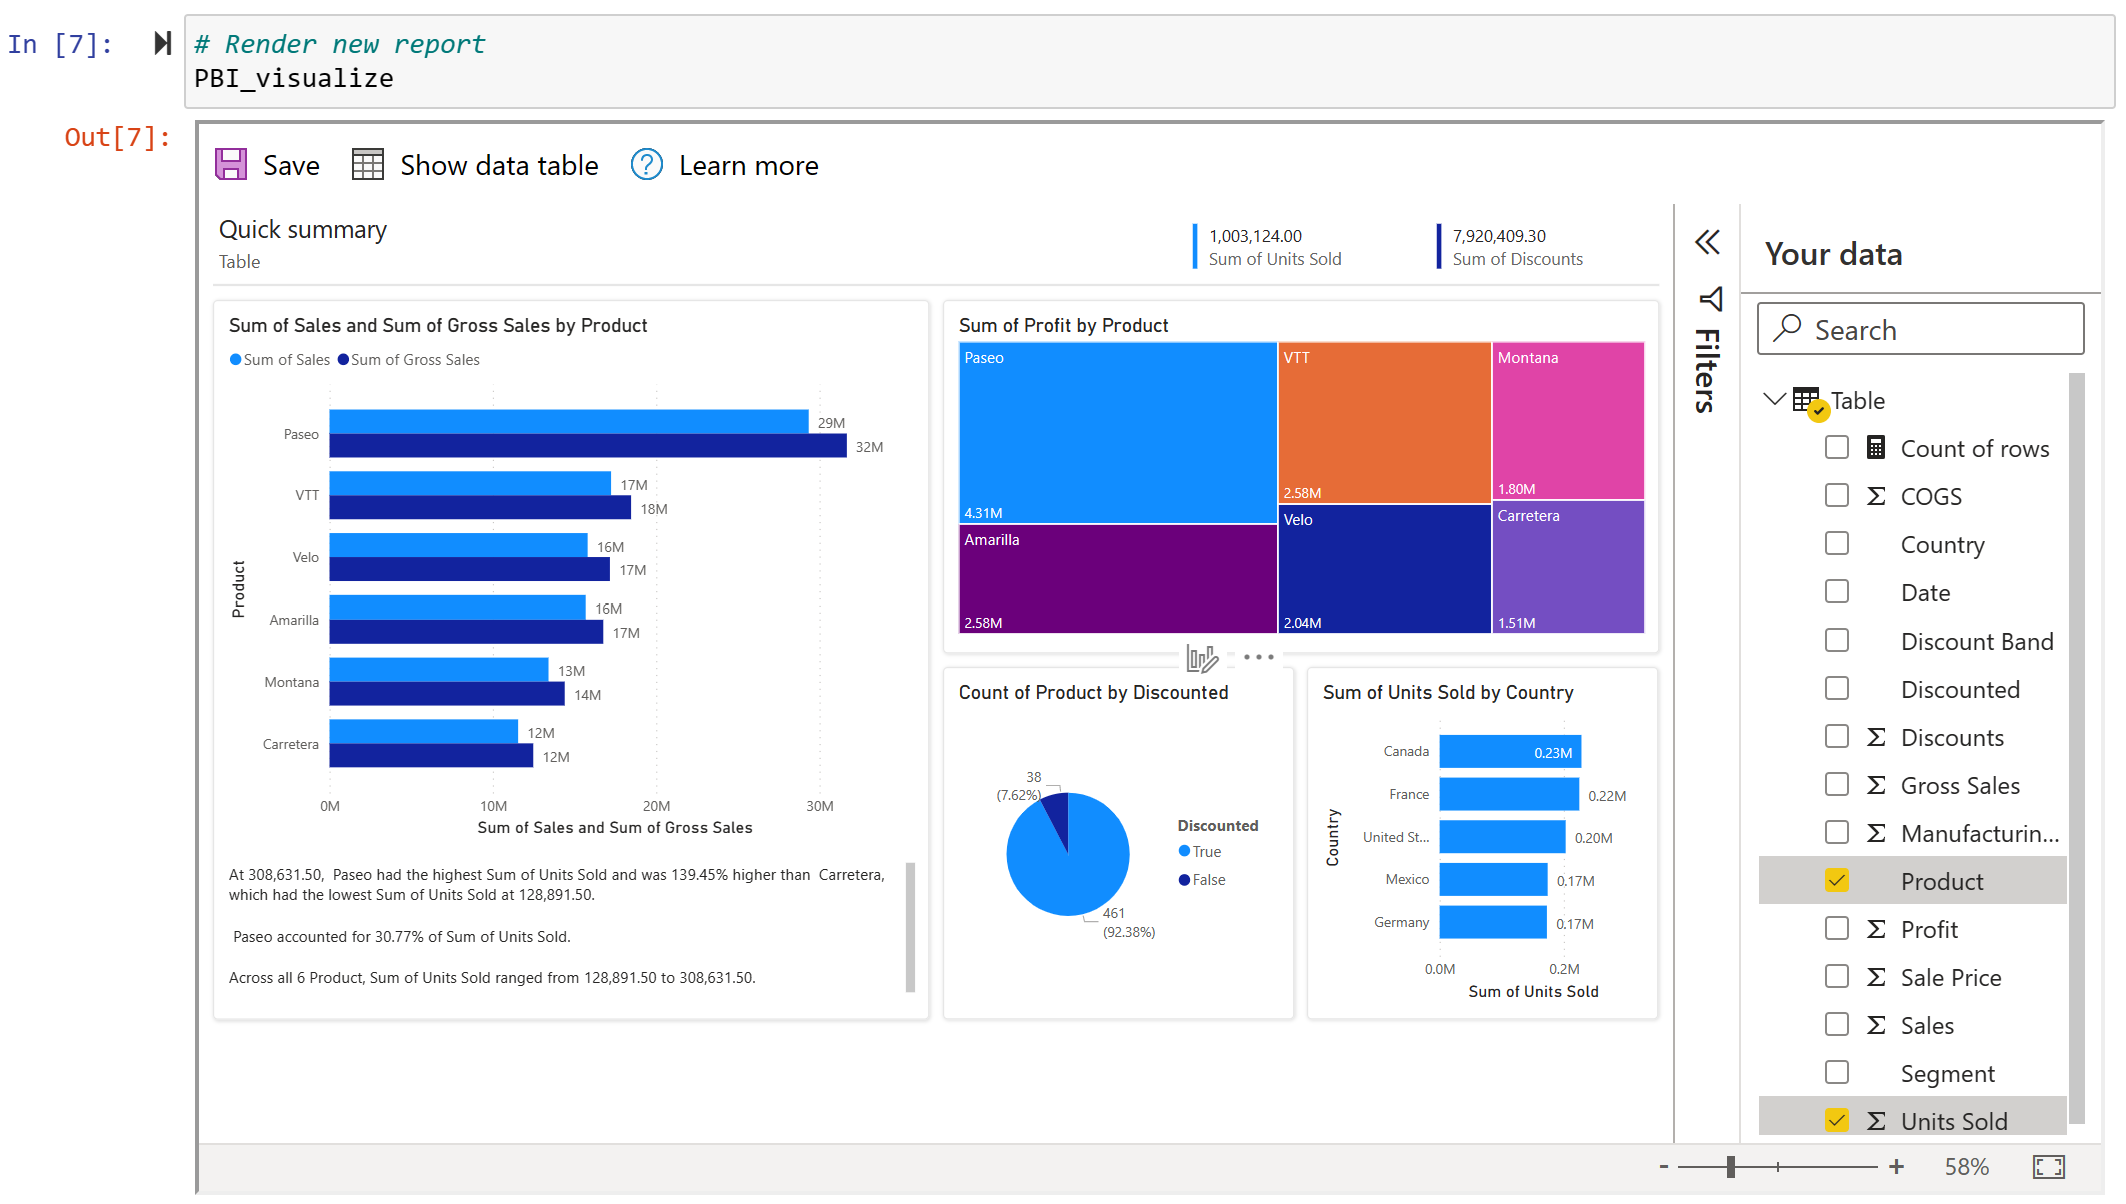
# Render new report
PBI_visualize
Customize the report (optional)
Once you created the report, you can customize it to get the most valuable insights from your data and create the perfect fit for the report in your notebook.
Edit the visuals and save them.
For more information, see Interact with autogenerated "quick" reports in the Power BI service.
Define the size of the container.
# Set new width and height for the container
PBI_visualize.set_size(400, 600)
For a demo Jupyter notebook, see the GitHub repository.
Related content
- Learn more about developing in Jupyter notebook
- Quick create demo Jupyter notebook GitHub repository
More questions? Try asking the Power BI Community
Feedback
Coming soon: Throughout 2024 we will be phasing out GitHub Issues as the feedback mechanism for content and replacing it with a new feedback system. For more information see: https://aka.ms/ContentUserFeedback.
Submit and view feedback for