Events
Mar 31, 11 PM - Apr 2, 11 PM
The ultimate Microsoft Fabric, Power BI, SQL, and AI community-led event. March 31 to April 2, 2025.
Register todayThis browser is no longer supported.
Upgrade to Microsoft Edge to take advantage of the latest features, security updates, and technical support.
In Excel Desktop or Excel for the web, you can discover all the Power BI semantic models that you have access to. You can explore that data in Excel spreadsheets using PivotTables and other Excel capabilities. With the Power BI semantic model experience in Excel, you can:
https://app.powerbi.com), where you can discover other data artifacts (including Power BI datamarts) and trusted data in your organization.Your organization’s tenant administrator must enable the Users can work with Power BI semantic models in Excel using a live connection tenant setting. Learn more about the Excel live connection tenant setting in the admin portal documentation.
For on-premises datasets, your organization’s tenant administrator also must enable the Allow XMLA endpoints and Analyze in Excel with on-premises datasets tenant setting. Learn more about the Allow XMLA endpoints tenant setting in the admin portal documentation.
Your version of Excel Desktop must be an updated version of Excel for the web. To see if you have the right build for Excel Desktop, open File > Account > About Excel and confirm that the first five digits of the Build number are greater than or equal to 15128.

You must have Build permission to the Power BI semantic model or have at least a Contributor role in the Power BI workspace containing your semantic model.
You must have a Fabric license: Fabric (free), Pro or Premium Per User (PPU). Fabric (free) license users can only work with datasets in My workspace or a Power BI Premium capacity or Fabric F64 or greater capacity. Learn more about Power BI licenses.
You can use Excel workbooks containing refreshable Power BI data in both Excel Desktop and Excel for the web.
To connect to live Power BI semantic models from inside Excel, use one of these two options:
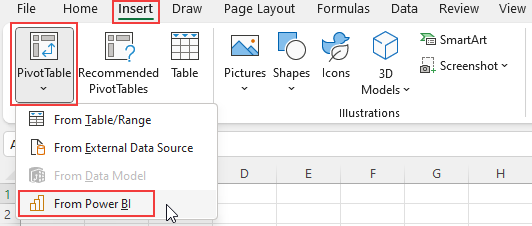
On the Insert tab in Excel, select PivotTable > From Power BI.

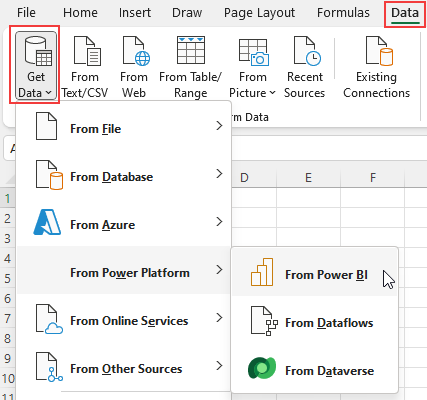
On the Data tab in Excel Desktop, select Get Data > Power Platform > From Power BI.

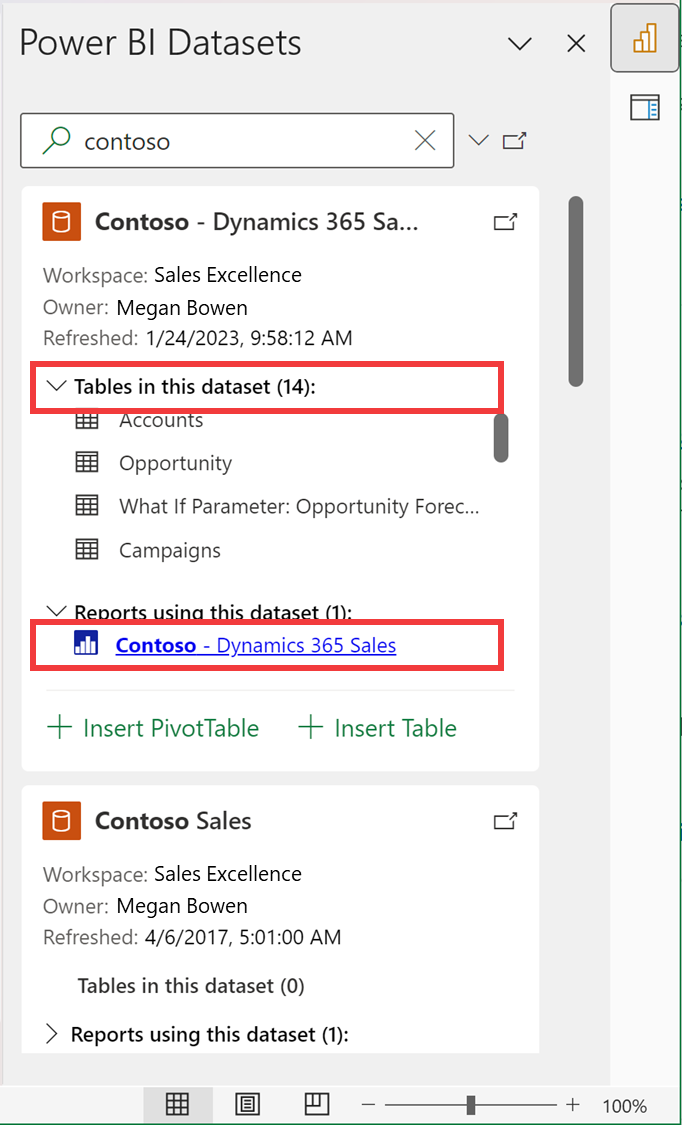
After you've selected From Power BI using either of these options, a pane opens on the right of the screen that shows Power BI semantic models you have access to.

Each semantic model card shows the following information:
https://app.powerbi.com)Near the search bar in the pane, there's also a redirect web link to the Power BI Data hub (https://app.powerbi.com/datahub). There, you can view all Power BI semantic models and other data artifacts you have access to. When you select the web link, the Power BI service opens in a new tab in your web browser.
To start exploring your Power BI data in Excel, select one of the pre-loaded semantic models in the pane or find additional semantic models by typing your search parameters in the search bar and pressing Enter on your keyboard.
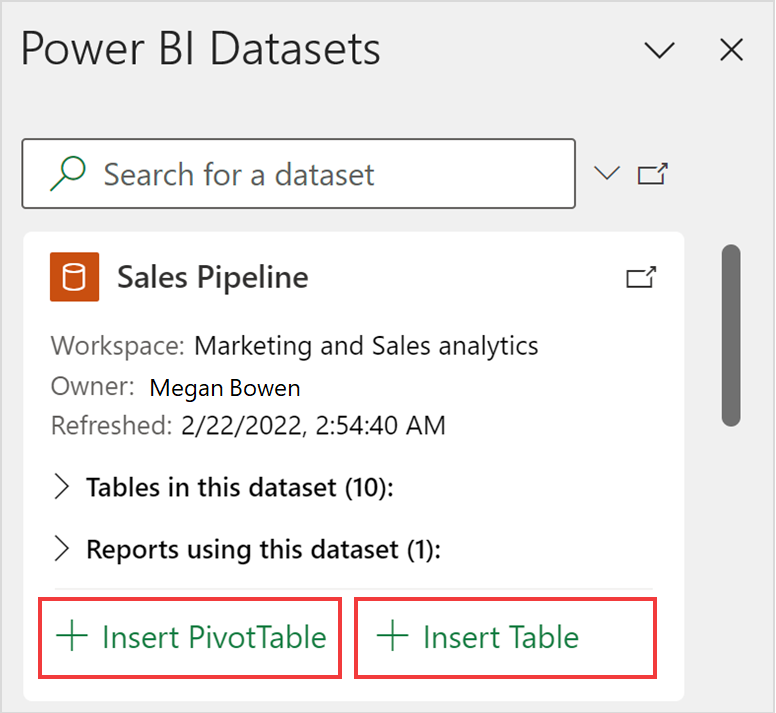
When you find the semantic model you want, select Insert PivotTable or Insert Table in the card. The Insert Table option is available in Excel Desktop.

When you select Insert PivotTable, a blank PivotTable is added to a new worksheet in your Excel workbook. In PivotTable Fields, you can see all the tables and measures from your Power BI semantic model. You can start building your report in Excel.
When you select Insert Table, the Create Table dialog opens, where you can use the Data, Build, and Filters panes to design the table you'd like. Use the Insert Table button to add the table to the Excel sheet.
After you select From Power BI in the Excel ribbon, the artifacts loaded in the pane are not all the semantic models you have access to. They're a selection of your most used semantic models. Use the search bar in the pane to get additional semantic models.
The Insert Table option is only available in Excel Desktop.
The order of Power BI semantic models in the pane may be different from their order in the Data hub in the Power BI service.
For newly created semantic models, recently refreshed semantic models, or semantic models that you just got access to, it may take up to 24 hours for these semantic models to show up in the Power BI Semantic models pane. If you don't see the semantic model you want, navigate to the Power BI OneLake data hub (https://app.powerbi.com/datahub) from the Power BI Semantic models pane in Excel and use Analyze in Excel to create an Excel workbook for that semantic model.
Excel and Power BI visuals use different query languages and data load behaviors, so data load performance can be different between Excel and Power BI.
The Power BI Datasets in Excel Add-In is currently unavailable in Excel for the web in all Sovereign clouds.
For more information about getting data into Excel, see Create a PivotTable from Power BI semantic models in the Excel documentation.
You can also access featured tables in Excel, in the Data Types gallery. To learn more about featured tables and how to access them, see Access Power BI featured tables in Excel organization data types. You can also read about using Excel data types from Power BI in the Excel documentation.
Events
Mar 31, 11 PM - Apr 2, 11 PM
The ultimate Microsoft Fabric, Power BI, SQL, and AI community-led event. March 31 to April 2, 2025.
Register todayTraining
Learning path
Work with semantic models in Microsoft Fabric - Training
Designing reports for enterprise scale requires more than just connecting to data. Understanding semantic models and strategies for scalability and lifecycle management are key to a successful enterprise implementation. This learning path helps you prepare for the Fabric Analytics Engineer Certification.
Certification
Microsoft Certified: Power BI Data Analyst Associate - Certifications
Demonstrate methods and best practices that align with business and technical requirements for modeling, visualizing, and analyzing data with Microsoft Power BI.