Overview of HPC Cluster Manager
HPC Cluster Manager is the central tool for configuring, deploying, and administering Microsoft HPC Pack clusters.
This topic covers the following aspects of HPC Cluster Manager:
Opening HPC Cluster Manager
You can open HPC Cluster Manager on the head node of your cluster or on a different computer where HPC Cluster Manager and the other client utilities have been installed. If you have installed HPC Cluster Manager on a different computer, this computer must be able to connect over the network to the head node of the cluster that you want to manage.
Important
To complete this procedure, you must log on with a domain user account that has been added as an HPC cluster administrator to the cluster that you want to manage. For more information, see Understanding User Roles.
To open HPC Cluster Manager in Windows Server 2012
Open the Start screen using one of these methods:
Press the Windows logo key. In a virtual machine, you can press Ctrl+Esc.
Hover the mouse cursor in the upper right corner of the screen, and then click Start.
On the desktop, hover the mouse cursor in the lower left corner of the screen, and click when the thumbnail of the Start screen appears.
Right-click the Start screen and click All apps in the bottom right corner.
Navigate to HPC Pack 2012, and then click HPC Cluster Manager.
If the Select Head Node dialog box appears, in the Another computer box, type or select the computer name of the head node that you want to manage, and then click OK.
To open HPC Cluster Manager in Windows Server 2008 R2 and earlier
Click Start, point to All Programs, click Microsoft HPC Pack, and then click HPC Cluster Manager.
If the User Account Control dialog box appears, confirm that the action it displays is what you want, and then click Continue.
If the Select Head Node dialog box appears, in the Another computer box, type or select the computer name of the head node that you want to manage, and then click OK.
Map of HPC Cluster Manager
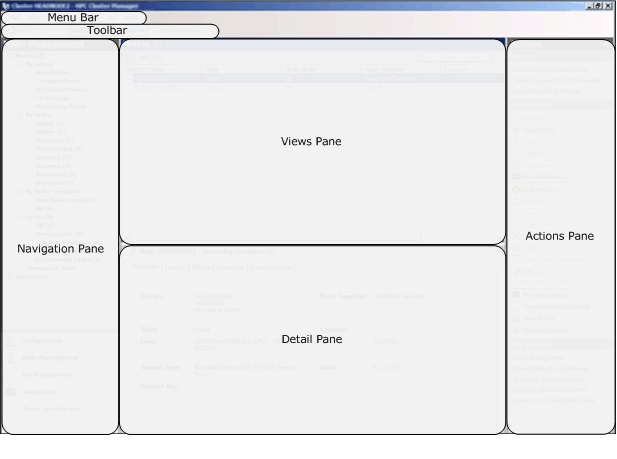
The HPC Cluster Manager screen is shown in the following figure:

HPC Cluster Manager
The Navigation Pane displays buttons to select a view, and a navigation tree for the current view. The available views are:
Configuration. In this view you can configure the HPC cluster, create node and job templates, and manage HPC cluster users. For more information, see Configuration: HPC Cluster Manager.
Node Management. In this view you can add nodes to your cluster, monitor node status, and perform management actions on nodes. For more information, see Node Management: HPC Cluster Manager.
Job Management. In this view you can monitor, manage and submit cluster jobs. For more information, see Job Management: HPC Cluster Manager.
Diagnostics. In this view you can run diagnostic tests on your cluster and view test results. For more information, see Diagnostics: HPC Cluster Manager.
Charts and Reports. In this view you can generate reports and view charts about cluster performance. For more information, see Charts and Reports: HPC Cluster Manager.
To display more or fewer buttons in the Navigation Pane
Click the down arrow of left navigation wunder bar.
Select Show Fewer Buttons.
Select Navigation Pane Options, and then select OK.
Close HPC Cluster Manager.
Open HPC Cluster Manager and preferences will be saved.
The center pane is divided into two parts:
The views pane displays individual items according to what you selected in the Navigation Pane.
The Detail Pane displays specific details according to what you selected in the views pane, such as compute node properties or job details.
The Actions pane displays the tasks and actions that are available for the selected view.
Using HPC Cluster Manager
The following example procedure demonstrates how you can use HPC Cluster Manager to see detailed information about the operations performed on your head node.
To see the operations log for your head node
In the Navigation Pane, click Node Management.
In Node Management, in the Navigation Pane, under Nodes, under By Group, click HeadNodes.
In the views pane, click your head node.
To see the operations log for your head node, in the Detail Pane, click the Operations tab.