マップに多角形レイヤーを追加する
この記事では、多角形レイヤーを使用してマップ上に Polygon および MultiPolygon フィーチャー ジオメトリの領域をレンダリングする方法を示します。 Azure Maps の Web SDK では、拡張 GeoJSON スキーマで定義されている円のジオメトリの作成もサポートしています。 これらの円は、マップ上にレンダリングされるときに多角形に変換されます。 atlas.Shape クラスでラップされている場合は、すべてのフィーチャー ジオメトリを簡単に更新できます。
多角形レイヤーを使用する
多角形レイヤーがデータ ソースに接続されていると、マップに読み込まれるときに、Polygon および MultiPolygon フィーチャーを含む領域がレンダリングされます。 多角形を作成し、データ ソースに追加し、PolygonLayer クラスを使用して多角形レイヤーでレンダリングします。
次のサンプル コードは、ニューヨーク市のセントラル パークを赤い多角形で覆う多角形レイヤーの作成を示しています。
function InitMap()
{
  var map = new atlas.Map('myMap', {
    center: [-73.97, 40.78],
    zoom: 11,
    view: "Auto",

    //Add authentication details for connecting to Azure Maps.
    authOptions: {
      authType: 'subscriptionKey',
      subscriptionKey: '{Your-Azure-Maps-Subscription-key}'
    }
  });

  //Wait until the map resources are ready.
  map.events.add('ready', function () {

    /*Create a data source and add it to the map*/
    var dataSource = new atlas.source.DataSource();
    map.sources.add(dataSource);

    /*Create a rectangle*/
    dataSource.add(new atlas.Shape(new atlas.data.Feature(
    new atlas.data.Polygon([[
      [-73.98235, 40.76799],
      [-73.95785, 40.80044],
      [-73.94928, 40.7968],
      [-73.97317, 40.76437],
      [-73.98235, 40.76799]
    ]])
    )));

    /*Create and add a polygon layer to render the polygon to the map*/
    map.layers.add(new atlas.layer.PolygonLayer(dataSource, null,{
    fillColor: "red",
    fillOpacity: 0.7
    }), 'labels')
  });
}

多角形と線レイヤーを同時に使用する
線レイヤーを使用して、多角形のアウトラインをレンダリングします。 次のコード サンプルでは、前の例のように多角形がレンダリングされますが、今度は線レイヤーが追加されます。 この線レイヤーは、データ ソースに接続される 2 番目のレイヤーです。
function InitMap()
{
  var map = new atlas.Map('myMap', {
    center: [-73.97, 40.78],
    zoom: 11,
    view: "Auto",

    //Add authentication details for connecting to Azure Maps.
    authOptions: {
      // Get an Azure Maps key at https://azuremaps.com/.
      authType: 'subscriptionKey',
      subscriptionKey: '{subscription key}'
    }
  });

  //Wait until the map resources are ready.
  map.events.add('ready', function () {

    /*Create a data source and add it to the map*/
    var dataSource = new atlas.source.DataSource();
    map.sources.add(dataSource);

    /*Create a rectangle*/
    dataSource.add(new atlas.data.Polygon([[
    [-73.98235, 40.76799],
    [-73.95785, 40.80045],
    [-73.94928, 40.7968],
    [-73.97317, 40.76437],
    [-73.98235, 40.76799]
    ]])
          );

    //Create a polygon layer to render the filled in area of the polygon.
    var polygonLayer = new atlas.layer.PolygonLayer(dataSource, 'myPolygonLayer', {
    fillColor: 'rgba(0, 200, 200, 0.5)'
    });

    //Create a line layer for greater control of rendering the outline of the polygon.
    var lineLayer = new atlas.layer.LineLayer(dataSource, 'myLineLayer', {
    strokeColor: 'red',
    strokeWidth: 2
    });

    /*Create and add a polygon layer to render the polygon to the map*/
    map.layers.add([polygonLayer, lineLayer])
  });
}

多角形をパターンで塗りつぶす
多角形を色で塗りつぶすだけでなく、イメージのパターンを使用して多角形を塗りつぶすこともできます。 イメージのパターンをマップ イメージのスプライト リソースに読み込んでから、このイメージを多角形レイヤーの fillPattern プロパティで参照します。
イメージ テンプレートを多角形レイヤーの塗りつぶしパターンとして使用する方法を示す完全に機能するサンプルについては、「Azure Maps サンプル」の「組み込みのアイコン テンプレートを使用して多角形を塗りつぶす」を参照してください。 このサンプルのソース コードについては、「組み込みのアイコン テンプレートを使用した多角形の塗りつぶしのソース コード」を参照してください。
![]()
ヒント
Azure Maps Web SDK には、塗りつぶしパターンとして使用できるカスタマイズ可能なイメージ テンプレートがいくつか用意されています。 詳細については、画像テンプレートの使用方法のドキュメントを参照してください。
ポリゴン レイヤーをカスタマイズする
Polygon レイヤーにはごくわずかのスタイル オプションしかありません。 試してみるには、「Azure Maps サンプル」で「多角形レイヤー オプション」のサンプル マップを参照してください。このサンプルのソース コードについては、ポリゴン レイヤー オプションのソース コードを参照してください。
![[多角形レイヤー オプション] ツールのスクリーンショット。](media/map-add-shape/polygon-layer-options.png#lightbox)
マップに円を追加する
Azure Maps は、円の定義を提供する、GeoJSON スキーマの拡張バージョンを使用しています。 Point フィーチャーを作成すると、マップ上に円がレンダリングされます。 この Point には、値が "Circle" の subType プロパティと、メートル単位で半径を表す数値が指定された radius プロパティがあります。
{
    "type": "Feature",
    "geometry": {
        "type": "Point",
        "coordinates": [-122.126986, 47.639754]
    },
    "properties": {
        "subType": "Circle",
        "radius": 100
    }
}
Azure Maps Web SDK では、このような Point フィーチャーが Polygon フィーチャーに変換されます。 次に、これらのフィーチャーは、次のコード サンプルで示すように、多角形レイヤーと線レイヤーを使用してマップ上にレンダリングされます。
function InitMap()
{
  var map = new atlas.Map('myMap', {
    center: [-73.985708, 40.75773],
    zoom: 12,
    view: "Auto",

    //Add authentication details for connecting to Azure Maps.
    authOptions: {
      // Get an Azure Maps key at https://azuremaps.com/.
      authType: 'subscriptionKey',
      subscriptionKey: '{Your-Azure-Maps-Subscription-key}'
    }
  });

  //Wait until the map resources are ready.
  map.events.add('ready', function () {

    /*Create a data source and add it to the map*/
    var dataSource = new atlas.source.DataSource();
    map.sources.add(dataSource);

    //Create a circle
    dataSource.add(new atlas.data.Feature(new atlas.data.Point([-73.985708, 40.75773]),
    {
      subType: "Circle",
      radius: 1000
    }));

    // Create a polygon layer to render the filled in area
    // of the circle polygon, and add it to the map.
    map.layers.add(new atlas.layer.PolygonLayer   (dataSource, null, {
      fillColor: 'rgba(0, 200, 200, 0.8)'
    }));
  });
}

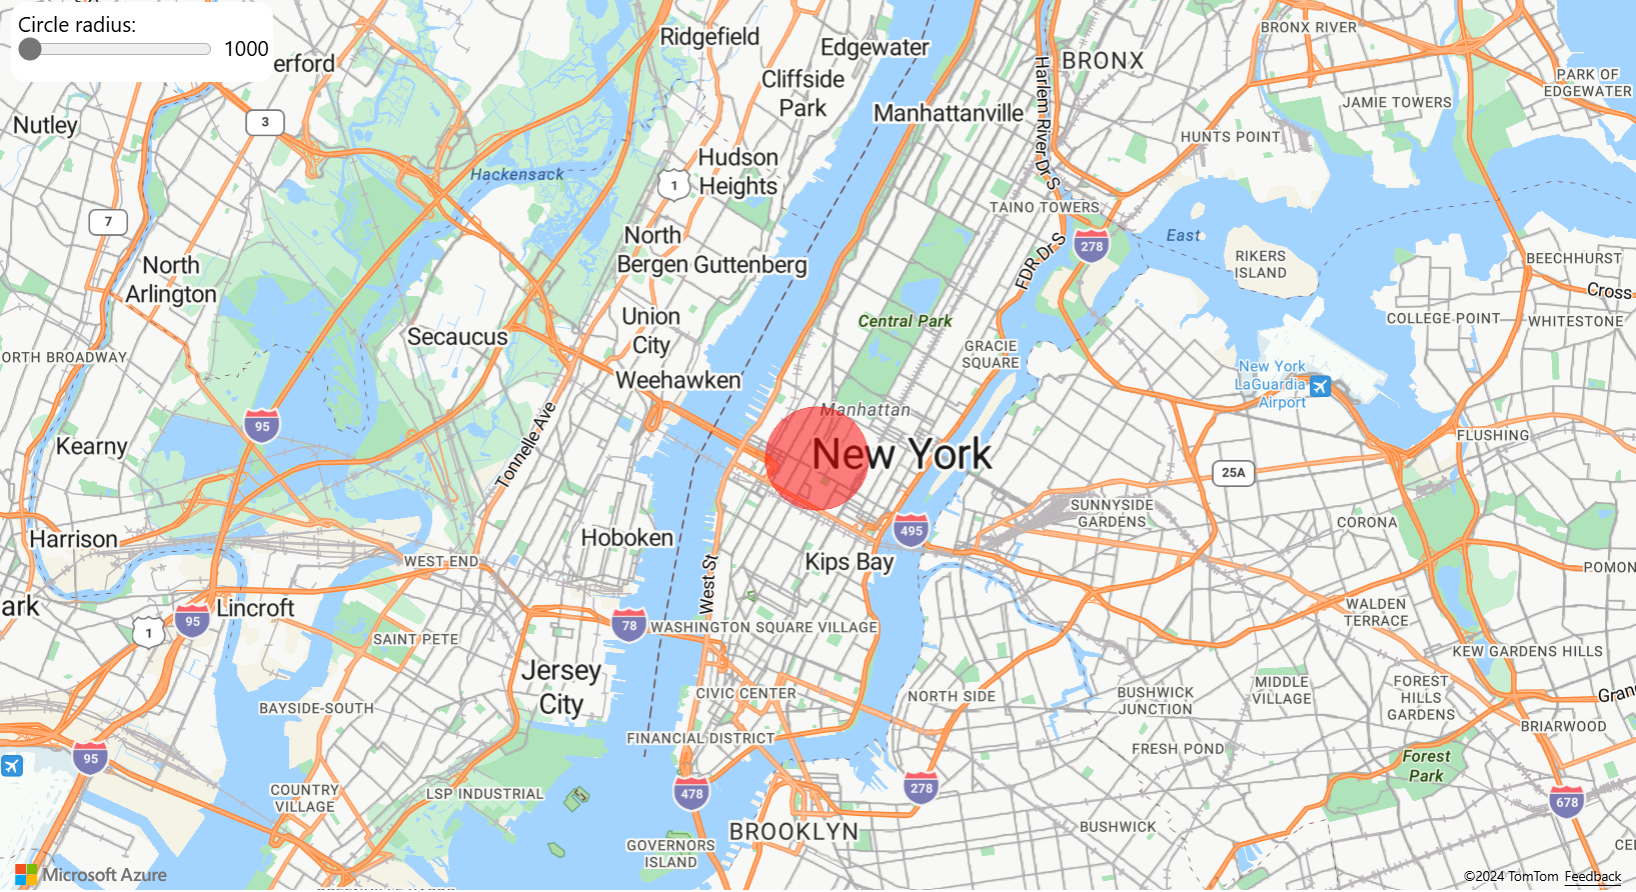
ジオメトリを簡単に更新する
Shape クラスは Geometry または Feature をラップしているため、これらのフィーチャーの更新や管理が簡単です。 図形変数をインスタンス化するには、図形コンストラクターにジオメトリまたはプロパティのセットを渡します。
//Creating a shape by passing in a geometry and a object containing properties.
var shape1 = new atlas.Shape(new atlas.data.Point[0,0], { myProperty: 1 });

//Creating a shape using a feature.
var shape2 = new atlas.Shape(new atlas.data.Feature(new atlas.data.Point[0,0], { myProperty: 1 });
[ジオメトリを簡単に更新する] サンプルでは、円 GeoJSON オブジェクトを図形クラスでラップする方法を示しています。 図形で半径の値が変化すると、マップ上で自動的に円がレンダリングされます。 このサンプルのソース コードについては、「ジオメトリを更新しやすくするソース コード」を参照してください。
次のステップ
この記事で使われているクラスとメソッドの詳細については、次を参照してください。
マップに追加するコード例の詳細については、次の記事を参照してください。
その他のリソース: