Adicionar uma camada de bolhas a um mapa (SDK do Android)
Este artigo mostra como você pode renderizar os dados de ponto de uma fonte de dados como uma camada de bolhas em um mapa. As camadas de bolhas renderizam pontos como círculos no mapa com raio de pixel fixo.
Observação
Desativação do SDK do Android do Azure Mapas
O SDK Nativo do Azure Mapas para Android já foi preterido e será desativado em 31/03/25. Para evitar interrupções de serviço, migre para o SDK da Web do Azure Mapas até 31/3/25. Para obter mais informações, confira O guia de migração do SDK do Android do Azure Mapas.
Dica
As camadas de bolha por padrão processarão as coordenadas de todas as geometrias em uma fonte de dados. Para limitar a camada de modo que ela só renderize recursos de geometria de ponto, defina a opção filter da camada como eq(geometryType(), "Point"). Se você também quiser incluir recursos do MultiPoint, defina a opção filter da camada como any(eq(geometryType(), "Point"), eq(geometryType(), "MultiPoint")).
Pré-requisitos
Conclua as etapas no artigo Início rápido: Criar um aplicativo Android. Os blocos de código neste artigo podem ser inseridos no manipulador de eventos onReady dos mapas.
Adicionar uma camada de bolha
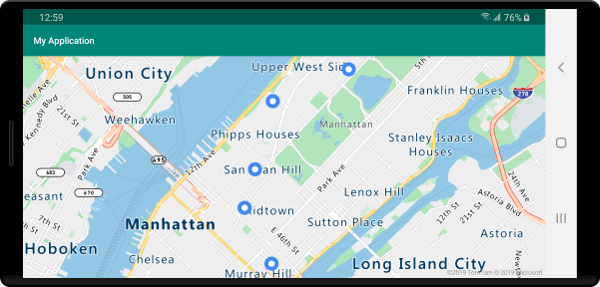
O código a seguir carrega uma matriz de pontos em uma fonte de dados. Em seguida, ele conecta os pontos de dados a uma camada de bolha. A camada de bolhas renderiza o raio de cada bolha com cinco pixels e uma cor de preenchimento branca. Além da cor do traço azul e da largura do traço de seis pixels.
//Create a data source and add it to the map.
DataSource source = new DataSource();
map.sources.add(source);

//Create point locations.
Point[] points = new Point[] {
    Point.fromLngLat(-73.985708, 40.75773),
    Point.fromLngLat(-73.985600, 40.76542),
    Point.fromLngLat(-73.985550, 40.77900),
    Point.fromLngLat(-73.975550, 40.74859),
    Point.fromLngLat(-73.968900, 40.78859)
};

//Add multiple points to the data source.
source.add(points);

//Create a bubble layer to render the filled in area of the circle, and add it to the map.
BubbleLayer layer = new BubbleLayer(source,
    bubbleRadius(5f),
    bubbleColor("white"),
    bubbleStrokeColor("#4288f7"),
    bubbleStrokeWidth(6f)
);

map.layers.add(layer);
//Create a data source and add it to the map.
val source = DataSource()
map.sources.add(source)

//Create point locations.
val points: Array<Point> = arrayOf<Point>(
    Point.fromLngLat(-73.985708, 40.75773),
    Point.fromLngLat(-73.985600, 40.76542),
    Point.fromLngLat(-73.985550, 40.77900),
    Point.fromLngLat(-73.975550, 40.74859),
    Point.fromLngLat(-73.968900, 40.78859)
)

//Add multiple points to the data source.
source.add(points)

//Create a bubble layer to render the filled in area of the circle, and add it to the map.
val layer = BubbleLayer(
    source,
    bubbleRadius(5f),
    bubbleColor("white"),
    bubbleStrokeColor("#4288f7"),
    bubbleStrokeWidth(6f)
)

map.layers.add(layer)
A captura de tela a seguir mostra que o código acima renderiza os pontos em uma camada de bolhas.

Mostrar rótulos de uma camada de bolha
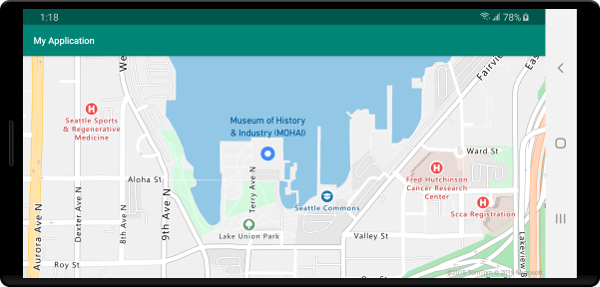
Este código mostra como usar uma camada de bolhas para renderizar um ponto no mapa. E, como usar uma camada de símbolo para renderizar um rótulo. Para ocultar o ícone da camada de símbolo, defina a opção iconImage como "none".
//Create a data source and add it to the map.
DataSource source = new DataSource();
map.sources.add(source);

//Add a data point to the map.
source.add(Point.fromLngLat(-122.336641,47.627631));

//Add a bubble layer.
map.layers.add(new BubbleLayer(source,
    bubbleRadius(5f),
    bubbleColor("white"),
    bubbleStrokeColor("#4288f7"),
    bubbleStrokeWidth(6f)
));

//Add a symbol layer to display text, hide the icon image.
map.layers.add(new SymbolLayer(source,
    //Hide the icon image.
    iconImage("none"),
    textField("Museum of History & Industry (MOHAI)"),
    textColor("#005995"),
    textOffset(new Float[]{0f, -2.2f})
));
//Create a data source and add it to the map.
val source = DataSource()
map.sources.add(source)

//Add a data point to the map.
source.add(Point.fromLngLat(-122.336641, 47.627631))

//Add a bubble layer.
map.layers.add(
    BubbleLayer(
        source,
        bubbleRadius(5f),
        bubbleColor("white"),
        bubbleStrokeColor("#4288f7"),
        bubbleStrokeWidth(6f)
    )
)

//Add a symbol layer to display text, hide the icon image.
map.layers.add(
    SymbolLayer(
        source,  //Hide the icon image.
        iconImage("none"),
        textField("Museum of History & Industry (MOHAI)"),
        textColor("#005995"),
        textOffset(arrayOf(0f, -2.2f))
    )
)
A captura de tela a seguir mostra o código acima renderizando um ponto em uma camada de bolhas e um rótulo de texto para o ponto com uma camada de símbolo.

Próximas etapas
Consulte os artigos a seguir para obter mais exemplos de código para adicionar aos seus mapas: