An End-To-End ETW Tracing Example: EventSource and TraceEvent
I have already made a series of blogs about EventSource starting with my tutorial introduction to EventSource. This gives you enough information to generate events, and using the PerfView tool, lets you look at these events in a viewer. This is great for a broad variety of ad-hoc scenarios. However what if you want to go further and build automation that processes your EventSource events programmatically? This is what this blog entry is about. Here I show you how to use the TraceEvent library (there is a old version of the code available here, but the version of this DLL that is included in the ZIP file associated with this blog is much newer, and I recommend using that until the codeplex site gets updated (hopefully soon). The TraceEvent library is all about reading ETW data, and it is the library that the PerfView tool itself is built upon. Here we show you how easy it is to use this library to programmatically enable your EventSources and parse the results programmatically.
You will notice that I have attached a SimpleMonitor.zip file to this blog entry. This zip file contains the TraceEvent.dll library as well as a simple, one page demonstration application called 'SimpleMonitor'. To demonstrate the 'end-to-end' scenario, this application contains both parts: the EventSource that generated the events as well as the logic that turns on the EventSource and parses the resulting events. Normally these two parts would be in different processes but to make the demo super-simple to run, both parts are in the same executable.
- The Event Generator generates 3 types of events, MyFirstEvent, MySecondEvent, and Stop. It happens to generate the first two once a second for 10 seconds then logs the Stop event and then goes silent. The listener code turns on this provider, watches for these particular events, takes different actions on each of them, using the event payloads in the events in the processing. The processing consists of computing the time delay between the 'MyFirstEvent' and 'MySecondEvent'. When it sees the 'Stop' event the listener shuts down and the whole program exits. This example is simple enough to demonstrate the end-to-end process in a small amount of code. Here is a condensed version where I simplified it to highlight the essentials.
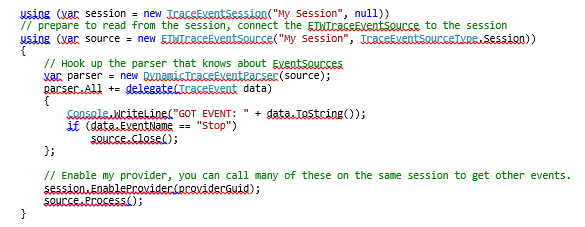
Basically you create a TraceEventSession which is a 'sink' which represents a stream of ETW events. These sessions are KERNEL objects, and in particular they can live beyond the lifetime of the process that created them (thus you can have one process 'start' a session' and another 'stop' it. You can create a session that logs to a file, but in this case we passed 'null' as the file name which means we don't want it to go to a file but we will read it in 'real time'. Session are for CONTROLLING ETW sessions (thus you see that later we do an 'EnableProvider' on the session to turn on the particular EventSource we want. You an turn on many providers on the same session, but in this case we did only one.
Because we want to READ the data that is being logged to this session in real time, we attach a 'ETWTraceEventSource' to the session. This knows how to READ etw events. You can tell this to read from a file, but in our case we told it to read in real time directly from 'My session', so this is where it will get its data. Now an ETWTraceEventSource knows how to read ETW events, but every different provider has its own different 'payloads' and you need something that understand the particular payload for the events you are interested in decoding completely. This is what a 'TraceEventParser' is: something that knows how to parse a PARTICULAR provider's events. We will see in later blog entries how we can create TraceEventParsers that are designed to decode just ONE EventSource's events, however in this case we are using the 'DynamicTraceEventParser' which knows how to decode ANY EventSource (but can only do so relatively inefficiently and is relatively cumbersome to code against).
One way you can get parsed events from a TraceEventParser is to ask the parser to call you back when a particular event happens. In this case we ask the DynamicTraceEventParser, to call us back whenever any event happens (by subscribing to the 'All' event). Thus the anonymous delegate shown above get a callback whenever any event happens that the 'DynamicTraceEventParser' knows how to parse (which includes all EventSources). In the demo we simply print the event (which will show you all the payload fields printed out nicely as XML), and look for an event called 'Stop'. When that happens to close the source (which stops the listern).
Once we have set up the callbacks for our READER, we turn our attention back to the SESSION and tell it to actually enable the EventSource that we want. From that point events are starting to accumulate in the session. We then call the 'Process()' event on the SOUCE (the reader), which will start reading events from the session and dispatching them to the parsers which dispatch them to our callback. This continues until there are 'no more events'. For files, this is the end of the file, but for real-time sessions, it only stops when the source is closed (which we do when we see the Stop() event).
So in recap to get at EventSource event programmatically you
- Create a session which allows you to turn on and off particular event sources
- Enable one or more EventSources in the session
- Connect up a ETWTraceEventSource to the seesion which can READ the events
- Connect up a TraceEventParser, that knows how to PARSE a Particular provider's events
- Subscribe to the TraceEventParser's events that you are interested in. What you get back is a fully parsed event
- Call source.Process() which runs the dispatch loop and only returns when all events are read (or the source is closed())
- Call source.Close() or source.Dispose() (They are synonyms) when you are done
- Call session.Dispose() when you are done with the session (this is what the using clause does)
You can see that you can do all of this in just a few lines of code. If this piques your interest, you should definitely download the source and take a look. It is not long (2 pages), and most of it is comments that describes in detail what the code is doing. It is definitely worth a read.
Next time I will show you how this changes when you log to a file instead. In later blog entries I will also show you how you can build parsers that are specific to your EventSource, and make building the processing code easier and significantly more efficient. You can also turn on other providers that are built into the OS and the .NET Runtime, and capturing stack traces when event fire, which is where things really start to get interesting.
Source Code Guide
To look at the complete source, simply open the SimpleMonitor.zip file and copy it to your machine. You can build the solution in Visual Studio. All the interesting code is in Program.cs, and only consists of about 2 pages of code which hopefully you will recognize from the snippet above.
Comments
Anonymous
February 06, 2013
Hi Vance, Can you post a sample of how to create a TraceEventParser that is specific to an EventSource. Like you mention, DynamicTraceEventParser is not very efficient.Anonymous
November 05, 2014
Hi: I am stuck, and I'm hoping you can point me in the right direction. I was reading this article msdn.microsoft.com/.../jj123754.aspx, which describes several video playback events delivered via ETW. For example, one of the events is: Microsoft-Windows-MediaEngine Channel - MediaFoundationMediaEngine – 16 Level - win:Verbose – 5 Task - VideoFrameGlitch - 23 I tried to adapt the SimpleMonitor sample to report "Microsoft-Windows-MediaEngine" events, but nothing got reported. I also tried to modifying an existing trace tool that receives events using ETWTraceEventSource.EveryEvent, without much success either. I've used the existing trace tool for other projects and it's worked. If you have any insight into what I might be doing wrong, or if you have any suggestions regarding what I should try/experiment, I would be much obliged.Anonymous
November 05, 2014
Can you see the events using PerfView? If so can you point your monitor at the ETL file and does that work? Have you read the 'TraceEvent Programmers Guide' (in the nuget package), and in particular the section on RegisteredTraceEventParser? One of the more likely issues is that you did not use RegisteredTraceEventParser and because of that TraceEventSource can't decode the events, so you don't recognize the events as MediaEngine events.Anonymous
November 06, 2014
The comment has been removedAnonymous
November 06, 2014
Great. My strong suspicion is that the events are there, they are just not being parsed. I am very surprised by the PerfView behavior you are experiencing. ReDownloading and rerunning should fix it. If not, try removing %APPDATA%PerfView and then run PerfView again. The first step is to have an ETL file collected with PerfView that shows the events (parsed) in the 'events' view. If you get there, there is no question you can get your code to work (since PerfView is using the same library).Anonymous
November 06, 2014
I eventually got PerfView to collect logs (silly user error). PerfView does show those events, such as ""Microsoft-Windows-MediaEngine/VideoFrameGlitch"... I modified the SimpleMonitor to read from my ETL file, and I can confirm that those same events are seen by SimpleMonitor. When I revert the code back to using a TraceEventSession as the source/input for the ETWTraceEventSource, then SimpleMonitor doesn't report anything. I'm using the "Microsoft-Windows-MediaEngine" as my provider name, using TraceEventSession.GetEventSourceGuidFromName to get the GUID, and then using TraceEventSession.EnableProvider on the GUID. When I call ETWTraceEventSource.Process(), no events... even though I'm running the app that generates those same events for PerfView. I appreciate any suggestions that you have. (And thank you for your prior suggestions, as that advice allowed me to get this far.)Anonymous
November 06, 2014
OK. I figured it out... for whatever reason, TraceEventSession.GetEventSourceGuidFromName() returns a GUID that does not match what is reported to PerfView. Once I got the correct GUID mapping, things showed up.Anonymous
November 06, 2014
You should not use the TraceEventSession.GetEventSouceGuidFromName() for Microsoft-WIndows-MediaEngine because it is not an eventSource, it is a built in provider (what is known as a manifest provider). The right thing to do however, is to avoid GUIDS altogether. Just call the EnableProvider overload that takes a name rather than a GUID and it would have worked the way you expect.Anonymous
November 06, 2014
That's a nice bit of insight. I couldn't find an overload for EnableProvider(), but I was able to use TraceEventSession.GetProviderByName("Microsoft-Windows-MediaEngine") inside EnableProvider() to work. This has been useful for me. Thank you very much for your assistance.Anonymous
November 06, 2014
Sounds like you are using a pretty old version of TraceEvent. Version 1.0.22 has this overload (in fact all the samples us this, since it is best practice). But it sounds like you solved your problem.Anonymous
January 13, 2015
Any plans for a tutorial on a TraceEventParser?Anonymous
January 13, 2015
If you have not already seen it, there is a TraceEventProgrammers guide that tries to explain the basics (it is not complete). I do have some blogs I want to do, but there is so much to do it is unclear when it will happen.Anonymous
February 03, 2015
I've encountered a strange behavior where TraceEventSession.EnableProvider() sometimes returns false and sometimes returns true. I though maybe I was not disposing of things, but problems persist even after rebooting. Do you have any ideas what could cause this kind of behavior?Anonymous
August 04, 2015
Hi Vance, Nice article. I was wondering if there is a way to disable the event channels i.e. Admin, Operational, Debug and Informational programmatically i.e. provide a list of all the event channels published in the manifest and then enable/disable them and then based on this selection display the results. Thanks, RajAnonymous
April 28, 2016
Hey Vance,I'm currently unit testing an EventSource of mine (using EventListener) and have come across what seems like an omission or inconsistency: the range of EventOpcode.EventKeywords explicitly declares that it's a 64-bit number, but EventOpcode uses the default size (32-bit). From what I've been able to discover with dnSpy/ilSpy, it looks like EventOpcode is 8-bit (System.Diagnostics.Tracing.EventDescriptor .ctor). There doesn't seem to be any documentation about the range of this value and I'm not getting any exceptions for the 32-bit values that I attempted to use: a straight truncating cast to byte is transparently performed during metadata discovery.While I'm going to have to go with the 8-bit length regardless of any fixes you do; I'm curious if this is a bug and, if not, maybe it should be added to the documentation and/or doccomments.Anonymous
June 17, 2016
Hello Vance,Thanks for your useful post. I use sysmon internal tools that create interest log files from windows. it's log name is "Microsoft-Windows-Sysmon%4Operational.evtx". I want read this log Continuously. Help me please.