Introduction Tutorial: Logging ETW events in C#: System.Diagnostics.Tracing.EventSource
Event Tracing for Windows (ETW) is a fast, scalable logging mechanism built into the Windows operating system. It is powerful because of three reasons
- The operating system comes pre-wired with a bunch of useful events
- It can capture stack traces along with the event, which is INCREDIBLY USEFUL.
- It is extensible, which means that you can add your own information that is relevant to your code.
Tools like PerfView and Windows Performance Analyzer (formally XPERF) can be used immediately for (1) and (2) above. This blog is about doing (3). You can also watch the video of me going through the steps below.
When you log events to an ETW event stream, in ETW parlance, you are creating a ETW Event Provider. Sadly, historically creating a ETW event provider has been a non-trivial task, which writing an XML 'Schema manifest' and using a specialized tool (MC.exe) to generate source code to link into your application. You also need to register the provider using another obscure tool (WEVTUTIL) when your application was deployed. This discouraged most users from ever building their own ETW providers, which is a shame because it is a powerful feature of ETW.
To fix this, we have added the System.Diagnostics.Tracing.EventSource type to Version V4.5 of the .NET Runtime (Now available for download, as a release candidate. It will officially ship later in 2012). It makes writing ETW provider as simple as writing just a few lines of code. In this blog entry I will demonstrate just how easy it is to log your own events to the ETW data stream and thus make the OS ETW data EVEN MORE USEFUL by correlating it with what you are doing in your code.
The first step in logging ETW events is to decide what we need to log. We need to decide on a name for the provider, as well as the events and all their payloads. You can do this with just a few lines of code using EventSource. For example the code
sealed class MinimalEventSource : EventSource
{
public void Load(long ImageBase, string Name) { WriteEvent(1, ImageBase, Name); }
public static MinimalEventSource Log = new MinimalEventSource();
}
defines a new ETW provider called 'MinimalEventSource' (by default the name of your subclass of EventSource) and defines a event called 'Load' which has a payload which consists of long value called 'ImageBase' and a string called 'Name'. So for (the text in blue), we are just specifing what we want (what the 'shape' of the event is). Ideally this is all that we would specify, however to 'hook it up' we need to write a SMALL amount of 'boiler plate' code. This code is purple above where we pass the data to the 'WriteEvent' function, along with the 'Event ID' (this number starts at 1, and increases for each event you add to your provider). EventSource does the rest. That is not so bad!
The code in green simply creates a global variable called 'Log' which holds our EventSource (typically you only make one for the whole app). Now we can generate events simply by typing
MinimalEventSource.Log.Load(10, "MyFile");
TADA! you have just written the code necessary to write your very first ETW event. So, how do you turn it on. This is where PerfVIew comes into play. If you are not familiar with PerfView check out the Tutorial Videos. Perfview has some special support for EventSources that make it particularly easy to use . Lets assume we compiled the code above into an application called 'EventSourceDemo.exe'. To run that program with the 'MinimalEventSource turned on we can do
PerfView /OnlyProviders=*MinimalEventSource run eventSourceDemo.exe
This command turns on MinimalEventSource (do not forget the *, that * indicates is important and I will explain it in a later posting). The /OnlyProviders tells PerfView to ONLY turn on the listed providers (normally it turns on a default set of CLR and Kernel Events). The 'run' command then specifies that the rest of the command line should be executed as a command while those providers are active. The result is a file (because we did not specify it is called 'PerfViewData.etl'). After creating that file PerfView immediately opens it. The result is probably a display that looks like this
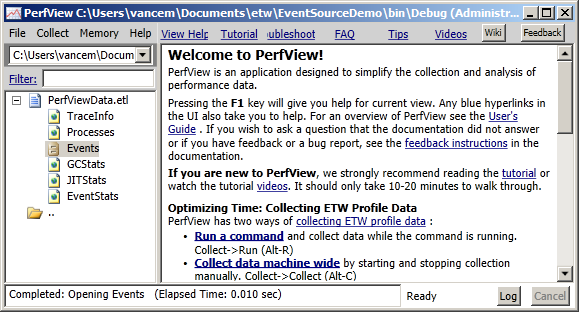
On the left, you wee the PerfViewData.etl file that was just created. If you open it you see various 'Views' of the data in that file. The one we care about right now is is the 'Events' view. Double clicking on that brings up the Event Viewer.
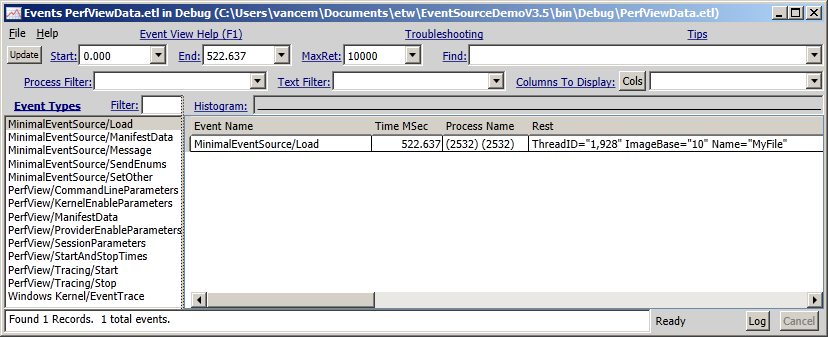
On the left you see all the events from all the ETW event providers that were captured in the file. You can see the ones from 'MinimalEventSource' as well as a bunch from 'PerfView' (Hmmm, I wonder what .NET library PerfView used to generate those ETW events?). By selecting events in that left pane (In particular the MinimalEventSource/Load event) and hitting return you will see all the events selected in the right pane. You can see in the above case the event that we logged in our sample code. Notice that we know that it was a load event, what process and thread, and time the event was logged, as well as the payload values (ImageBase and Name) that were passed when it was logged. Just what you might expect.
OK Now your turn. At the end of the article is a ZIP archive of all the source code for EventSoruceDemo (it is actually significantly more complex that what I have shown above (there is a lot that I have not told you yet). The ZIP file contains both the source code as well as the compiled binary (in the bin\Debug directory). Because V4.5 has not shipped yet, I have made it super-easy for you to try this out by including a 'stand-alone' EventSource.dll binary that works on current runtimes. Thus you can try this out by doing
- Extract the files in the ZIP file below.
- Download PerfView.exe from the PerfView Download Site.
- Open a command window in the PerfViewDemoV3.5\bin\debug directory
- Execute the command: PerfView /OnlyProviders=*MinimalEventSource run eventSourceDemo.exe
- Open up the 'events' view and take a look at the events generated.
Since you have the complete source, you can recompile it using Visual Studio (Free version here) to see how changing the code changes the events being logged. You can also use the EventSource.DLL in your own applications right now if you like (when V4.5 ships later this year, it will simply be part of the framework).
There is a lot more to say, as we have only done the 'hello world' version of event logging so far. However I hope I have at least piqued your interest. EventSource (and PerfView) make it truly easy to log events to ETW and thus leverage the power of all those existing OS events. If you are not adveneros to dowload it right now, you shoudl at least watch the video of me doing so.
OK, that is enough for this posting. I will post more soon, but in the mean time, have fun experimenting with the demo.
See Also
- EventSource Spec
- EventSource Users Guide
- Vance Morrison's EventSource Blogs
- Why use ETW EventSource
- End-to-End example using EventSource and TraceEvent
Comments
Anonymous
July 16, 2012
cool stuff.Anonymous
July 16, 2012
Excellent news that ETW is now looking like a far more viable logging mechanism for managed applications. Will we also get capability to programmatically parse/create ETL files or to treat them as a provider for an EventListener ? PerfView is not always the best tool for analysing results so we'd like to be able to collect data then post-process it for further analysis.Anonymous
July 17, 2012
Indeed once you have a ETL file, how do you look at it programatically? This is what the TraceEvent library that has been published to CodePlex is for (do a bing search on 'TraceEvent Library' to find it). This is the library that PerfView was built on. The version on CodePlex is a bit stale, but will work fine for simple sceanrios and we will be refreshing it soon anyway. I will be bloging about that in the near future.Anonymous
July 17, 2012
That's excellent news thanks Vance. Look forward to playing with this....Anonymous
September 04, 2012
is the EventSource class from codeplex compatible to the version in .net 4.5? Can I use the same code and add switches to use the codeplex version in .net 4.0 and the framework version in .net 4.5? And why are you doing the opposite of all other teams? They stripe out functionality into NuGet packages to update them faster and you move it to the core framework which makes it harder to get updates (special hotfixes or service packs).Anonymous
September 21, 2012
The comment has been removedAnonymous
September 23, 2012
ah, ok. I only saw some ETW code in the BCL repository and thought this is the code. But an you still provide a NuGet package for VS2010/.net 4.0 users to use the EventSource easily?Anonymous
January 25, 2013
What happened to the ChannelAttribute from the sample?Anonymous
January 25, 2013
Channel support is not official and is was not a priority for the sample.Anonymous
January 28, 2013
Found a bug in the implementation: Per MSDN, the EventTraceProperties.LoggerNameBuffer needs to come before EventTraceProperties.LogFileNameBuffer in NativeMethods.cs Fixing this also needs an update of the constructor so that the LogFileNameOffset and LoggerNameOffset are intialized correctly.Anonymous
January 29, 2013
How can I create the required views and profiles for the Windows Performance Analyzer for my custom event source. Although I do see events on the graph, I don't see any of their names.Anonymous
January 30, 2013
A future version of WPA will simply 'fix this' as they will read the manifest that the EventSource emits. We have an internal tool that I will blog about in the several weeks that will take an eventSource and publish its manifest in a way that windows tools including WPA. In the mean time you have to either use PerfView as to view as a work-around, or build and register the EventSource manifest (I am not going to bother to explain how to do this, either you are motivated enough to figure it out, or you will have to wait until I blog about the tool.Anonymous
January 30, 2013
Thanks for the reminder about creating a manifest. I'm currently building our own TraceEventParser for specific needs.Anonymous
April 12, 2013
This logger works really well: www.kellermansoftware.com/p-14-net-logging-library.aspxAnonymous
June 06, 2013
This is useful but it seems it is half baked even in .net 4.5. Ideally, you would want it to be able to create the channels Admin, Analytic etc in EventLog, create manifest etc to let EventLog and Perform Trace Session work. With this or a new API in 4.5 I could not find the way to do that so far unless I missed the trick.Anonymous
June 06, 2013
Well, I would not call it half-baked. It just incomplete in that it does not support a feature that you wish it had. Channel support is one of the features we do envision for EventSource however it was not put in V4.5 because the exact design was unclear, and it increased test cost substantially, and we had no clear users at the time. Under such circumstances, leaving it out is appropriate. It is plenty useful without that feature. We are working on a 'out of band' NUGET package for EventSouce that does include channel support which with luck we should publish this year. Finally, for those who are motivated/informed, you should be able to do channels with EventSoruce V4.5 because channel support only requires changes in the manifest. Thus you can get the manifest for your eventSource (EventSource.GetManifest), and then modify it to add the channel information, and register with the EventLog it with wevtutil. I have not personally done this, but it should work. .Anonymous
June 06, 2013
Hi Vance, Thanks for the quick reply, trick to get the manifest generated is useful definitely, I will most likely use that for now... I look forward to use the NUGET package when it comes. Apart from this, your blogs are very useful to understand the ETW from ground up so thanks for taking effort to bring them to the wider audience.Anonymous
June 27, 2013
Hi Vance, I ve managed to get the events logged into specific channels e.g. event 1001 logged to Admin channel etc. I am however unable to log it when I add the keywords to the events in c# code. This behaviour is irrespective of whether I bind channel to the event or not. As soon as I add the Keyword(s) to the event in c# code (and/or corresponding entry to the manifest) it stops appearing in the event log. I can see the event viewer controller has enabled the keyword as "this.IsEnabled(EventLevel.Verbose, Keywords.Request)" returns true but it does not appear in the event log, not even in the Debug channel. Thanks.Anonymous
July 01, 2013
I don't really have personal experience with using keywords and channels, so I can't comment on the behavior you are seeing. We are adding channel support to the Nuget EventSource right now, so we should be able to tell you more reasonably soon (say a week or two).Anonymous
July 09, 2013
Hi Vance, Our team is adopting the EventSource class. I was able to get it working with perfview. Is there a way to enable the tracing using "Performance Monitor->Data Collector sets"? My event Provider is not showing up on this list. From reading your blogs(very useful) and comments I understand there is no channel support for EventSources. do I have to generate the manifest with appropriate channel information and register it for my EventSource provider to show up on this list? You spoke abt a tool that will let me do this? Where can I get it? Thanks.Anonymous
October 03, 2013
Just wanted to throw out a note. I work on Bing and we use EventSource extensively in parts of our platform. We have been using it as our primary logging platform, emitting about 1GB of data per minute per machine. EventSource itself is extremely efficient (<1% of our total process time) and we have not had any issues with data loss or functionality. It's an amazing addition to the .NET framework.Anonymous
October 29, 2013
Can't get it working. I created a WebApiEventSource in my WebApi application (as ITraceWriter impl): { [EventSource(Name = "WebApi", Guid = "{E81D913C-003A-4A92-8648-37B287F4E909}")] public class WebApiEventSource : EventSource public static readonly WebApiEventSource Log = new WebApiEventSource(); public void Event(string url, string message) { WriteEvent(1, url, message); } } I checked that EventSource's methods are called without errors. Then I run PerfView and can see in its log that it does see my provider (EventSource): Parsing Spec *WebApi Enabling Provider:*WebApi Level:Critical Keywords:0x0 Options:None Values: Guid:fc7bbb67-1b01-557b-5e0e-c1c4e40b6a24 Then I run 'collect' with filter "*WebApi" and stop it. But there're no my events in etl's Events! What did I miss?Anonymous
October 30, 2013
The comment has been removedAnonymous
January 03, 2014
It seems I've to run the program under perfview in order to enable tracing. Is there anyway I can turn on the same provider using logman or xperf? I guess I need to call GenerateManifest, get the proivder name from the manifest and register using WEVTUTIL, then run logman or xperf command to turn on the provider, Is that correct? Are any other simpler way of doing this?Anonymous
January 03, 2014
How can I turn on the provider without using Perfview? It seems I've to run the program under perfview in order to enable tracing. Is there anyway I can turn on the same provider using logman or xperf? I guess I need to call GenerateManifest, get the proivder name from the manifest and register using WEVTUTIL, then run logman or xperf command to turn on the provider, Is that correct? Are any other simpler way of doing this?Anonymous
January 03, 2014
Yes you can turn on EventSources with other ETW based tools (logman or xperf). Note however that PerfView works JUST LIKE THESE OTHER TOOLs so there really should be no advantage of using XPERF over PerfView/. PerfView is frankly always a better ETW collector (for managed code at least) than XPERF in pretty much every scenarios. The only value logman has is that it ships with windows and thus you don't need deploy perfView. XPERF an logman are old tools and thus are not as easy to use. WPR (the successor to XPERF), does have support for accessing EventSources by name (without registration). Thus that tool is better than XPERF or Logman. However you can use XPERF or LOGMAN as long as you know the GUID for you EventSource. The easiest way to determine this is to turn the EventSource on with PerfView and look at its log where it will show you the GUID it used. You can then use that GUID in XPERF or Logman. Note that that GUID for the EventSource is a property of the EventSource, so if you an modify the source code you can print it out. You do not need to register the manifest associated with your EventSource in order to use logman or XPERF to log events (but you will need to use the GUID in that case). Finally the easiest way to register an EventSource with the OS using WEVTUTIL is by using EventRegister tool, which is available on Nuget. (see www.nuget.org/.../Microsoft.Diagnostics.Tracing.EventRegister) This was really intended for EventSource Channel support (which requires registration see blogs.msdn.com/.../the-eventsource-nuget-package-and-support-for-the-windows-event-log-channel-support.aspx) but it will work for other tools too.Anonymous
April 21, 2014
these discussion is very useful....Anonymous
September 12, 2014
I have been trying to write my own ETW events in our WCF Windows Service (VB .Net 4.5) and capturing and viewing the ETL data with PerfView. I can never seem to get any events captured from that service. I tried the EventSourceDemo and it worked fine. I tried creating a console app in VB on my own using "AnotherEventSource" as my implementation and was able to capture and view those events in PerfView also. So I'm lost as to why it won't work in the windows service. I am just running the service exe locally in console mode at this point. Any suggestions on troubleshooting next steps? It's just a real basic implementation of ETW at this point.Anonymous
September 12, 2014
This is very surprising. ETW should not care at all whether the events are in a service or not. More likely you have an error in the event definition and on older version of EventSource (V4.5), it is easy to miss this fact (see blogs.msdn.com/.../10380233.aspx). Thus you should take the EXACT eventsource and run it from your console application and confirm it works THEN try it in the service. Most likely you will find that there is something wrong in the EventSource definition (the blog shows you how to debug it or you can use the NuGet package that makes it even easier to find the problem)Anonymous
September 12, 2014
I just figured out my problem. I recalled reading a note about how if the event IDs are the same with your logging methods this will cause your events not to appear. Well, it appears there is a similar but slightly different gotcha: if the event IDs are different but the method signature is the same, you will have the same problem. See sample code below: the second and third signatures to WriteEvent are the same. Once I corrected this, my events started showing up in the windows service. Public Sub Load(ByVal imageBase As Long, ByVal imageName As String) WriteEvent(1, imageBase, imageName) End Sub Public Sub Message(ByVal message As String) WriteEvent(2, message) End Sub Public Sub MessageFormat(ByVal messageFormat As String, ByVal ParamArray args() As Object) WriteEvent(3, String.Format(messageFormat, args)) End SubAnonymous
October 19, 2014
too bad we can only pass basic parameters to events...can't avoid the ToString()Anonymous
October 20, 2014
I am not certain I understand your comment. If you are saying it is too bad that you can't pass arbitrary object types to EventSource then I think there is a misunderstanding of the purpose of strongly typed events. The goal is NOT to be a remoting system, that allow arbitrary data structures to be passed around among a distributed system. This is a HARD problem (with tendrils into object identity and lifetime that generally don't work in practice) that basically is only partially solved. For logging especially, that cost-benefit of such a system is pretty poor. After all you are not trying to invoke arbitrary logic on logged object, mostly just doing statistical analysis and running simple state machines. You WANT as little information as you can get away with and still perform your diagnosis. If all you wanted was 'printf' from your logging, well, you can get that,as shown above, the value of strongly typed events does not really show through. What strongly typed events do is give you ONE BIG STEP above strings, in the sense that there is now several fields that you can COUNT on, and a CONTRACT of the names and types of these fields like so that these analysis state machines are easier to write, more efficient, and robust to change (since the event provider KNOWS it should not break that contract). If you log only one string with your event, then the contract is pretty trivial, but typically you find that you can do much better than that.Anonymous
February 04, 2015
Could you please elaborate on how perfview enables "MiniamlEventSource" provider? I tried to run the example and enable the this provider with logman, but getting an error: C:perf>logman start process_trace -p *MinimalEventSource -ets Error: Element not found.Anonymous
February 04, 2015
PerfView (and WPR) have special support for the *NAME syntax (which takes a name and hashes it to a GUID). logman does not, so you can't use the *NAME syntax. You need to use the real GUID. You can find out what this GUID is by using PerfView and looking in the log where it shows each provider (along with its name and GUID) that it turns on. From the log I see Enabling Provider:*MinimalEventSource Level:Critical Keywords:0x0 Stacks:0 Values: Guid:7370a335-9b9a-5ba0-63c2-8ce045c35503 Thus you can use that GUID to turn on MinimalEventSource with logman.Anonymous
February 05, 2015
Thanks, the following command worked: C:perf>logman start process_trace3 -p {73711111-9b9a-5ba0-63c2-8ce045c35503} -ets It created a trace file ( process_trace3.etl ). But when trying to decode the messages in that file using: C:perf>tracerpt -l process_trace3.etl -export file.man The messages shown in their raw binary forms. and the man file does not contain real information. Is the only way around it is to use EventSource.GenerateManifest in the code, save it to file and then use wevutil to register the manifest?Anonymous
February 05, 2015
The comment has been removedAnonymous
February 06, 2015
My final goal is to create an ETW provider on windows phone. Are the following technologies: EventSource class, mc and wevuil utilities, NuGet package, are available on the phone? (or would run also on win phones)Anonymous
February 06, 2015
EventSource is supported in sufficiently new phone frameworks, that is the preferred solution. I think you can also use the EventSource Nuget package on the phone (but I have not done it personally). MC.exe is not needed for EventSource. My understanding is that wevtutil is NOT available (but again it is not needed for EventSource). There is 'field Medic' which is a app for the phone that can turn on ETW providers (thus taking the place of WPR or logman or PerfView.Anonymous
March 29, 2015
The comment has been removedAnonymous
March 29, 2015
logman only shows you providers that have registered themselves with the operating system. EventSouce do not do this by default because you need to have an ADMIN level install command (and thus an uninstall command), and frankly is not necessary for many scenarios. Channel support needs to have a OS-Registered provider, so if you follow the instructions for registering a provider for Channel support, it will work in Logman as well see blogs.msdn.com/.../the-eventsource-nuget-package-and-support-for-the-windows-event-log-channel-support.aspx In particular the EventSourceSamples Nuget package has examples that register an EventSource and the EventSourceUsersGuide (see blog above), goes into more detail. However registering your EvenSource with the OS introduces a bunch of complexity (you need an ADMIN installer), and thus it not recommended unless you absolutely need it. Consider that before proceeding.Anonymous
August 25, 2015
Hello, I am writing an in-process ETW provider. My application run as a service. I am not able to Enable Kernel provider when the service runs as Network Service. MSDN says that it should be able. What am I doing wrong?Anonymous
August 26, 2015
I am no expert with respect to the security attributes a process has when running as Network Service, or even the exact requirements needed to turn on particular ETW kernel events. However turning on ETW kernel events allows you to see all aspects of the computer so I would expect it to be locked down to admins. The exact details I don't know.