Explore data in Real-Time Dashboard tiles (preview)
The explore data feature enables you to delve deeper into the data presented in any Real-Time Dashboard. If the information you're seeking isn't readily available on the dashboard, this feature allows you to extend your exploration beyond the data displayed in the tiles, potentially uncovering new insights.
Important
This feature is in preview.
Even if a dashboard is shared with you and you only have viewer permissions, you can still explore it. The exploration process begins with viewing the data and its corresponding visualization as they appear on the tile. From there, you can further explore the data by adding or removing filters and aggregations, and viewing your results using different visualizations, all without needing any knowledge of the Kusto Query Language.
This exploration can provide additional insights into your data, enhancing your understanding and decision-making capabilities.
Prerequisites
- A workspace with a Microsoft Fabric-enabled capacity
- A dashboard with visuals. For more information, see Create a Real-Time Dashboard
Start your data exploration
Within your workspace, select a Real-Time Dashboard.
On the tile that you'd like to explore, select the Explore data icon.
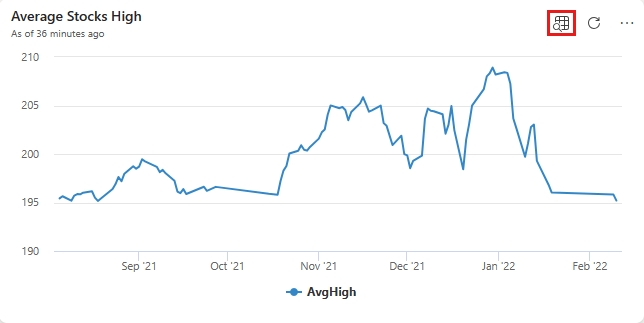
Explore data
When you open the explore data window, you start with the same visualization as shown in the tile.

In the explore data window, you see the following areas:
A. Filter and aggregations bar: Shows filters and aggregations from the original query, added filters and aggregations, and the refresh data button.
B. Visual pane: Shows the visualization of the query data.
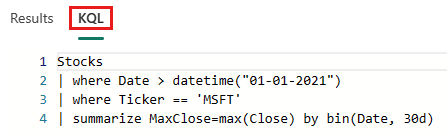
C. Results pane: Show the tabular results of the query data and the query in the Results and KQL tabs respectively.
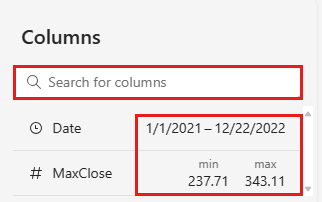
D. Columns pane: Shows the query columns and their metadata, value distributions, and sample values depending on their data type.
You can then explore your data without affecting the visualization shown in the tile in the following ways:
In the filters bar, you can remove, add, and modify filters and aggregations from the query.
Filters that came from the original tile query can't be modified and can only be removed in reverse order. You can add your own filters and aggregations, which you can later modify or remove as you explore.
To add a filter:
Select + Add.
Find and select the column you'd like to filter.
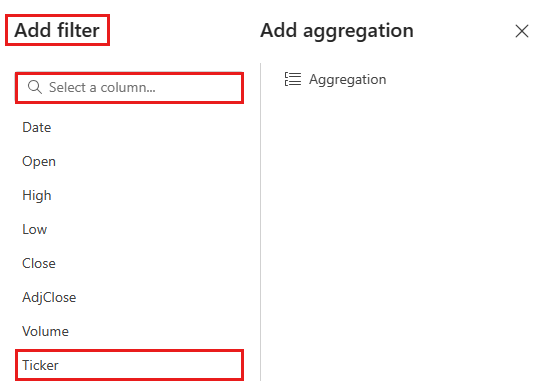
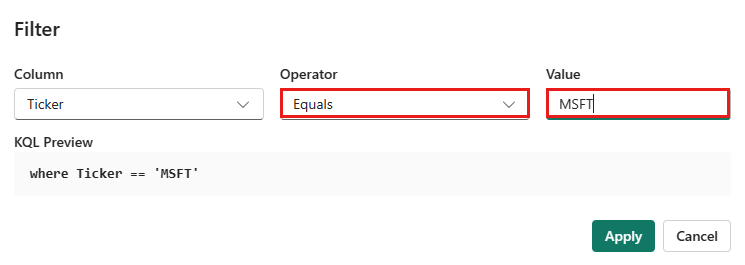
Select the filter Operator and Value, and then select Apply. The visual, results, and KQL query update to reflect the new filter.
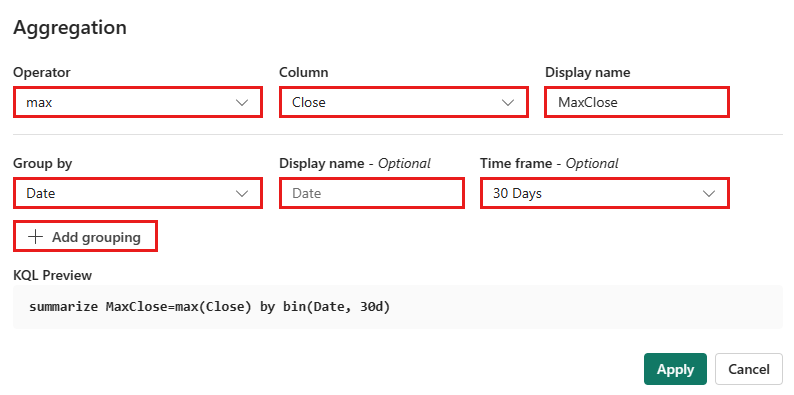
To add an aggregation:
Select + Add > Aggregation.
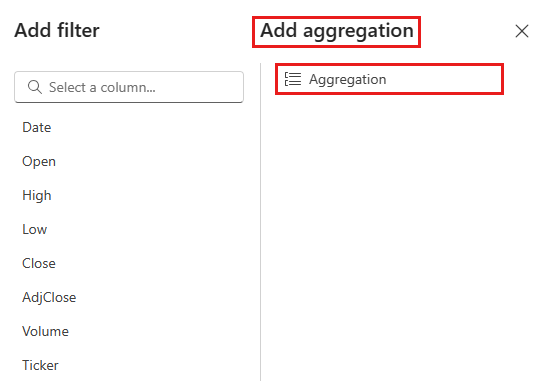
Select the filter Operator and Display Name, optionally add up to two columns to group by, and then select Apply. The visual, results, and KQL query update to reflect the new filter.
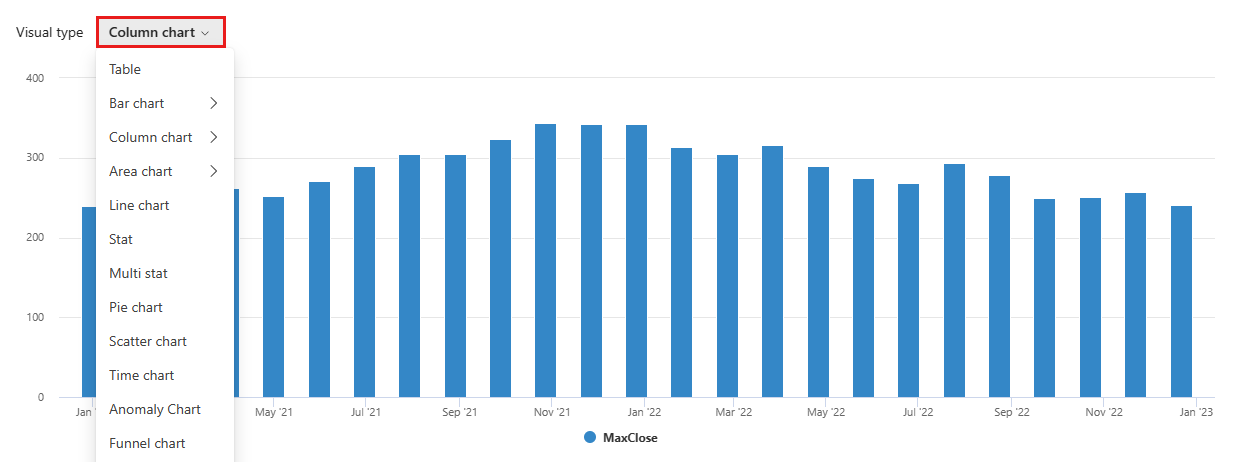
From the Visual type dropdown, select other visual types to visualize your data in different ways.
Select the Results and KQL tabs to view the tabular query results and the underlying query respectively. As you explore, you see the changes you make updated in these tabs.
In the Columns pane, you can browse the table schema by looking at the columns or finding a particular column. You can also choose columns to see their top values, value distributions, and sample values depending on their data type, as follows:
Related content
Feedback
Coming soon: Throughout 2024 we will be phasing out GitHub Issues as the feedback mechanism for content and replacing it with a new feedback system. For more information see: https://aka.ms/ContentUserFeedback.
Submit and view feedback for